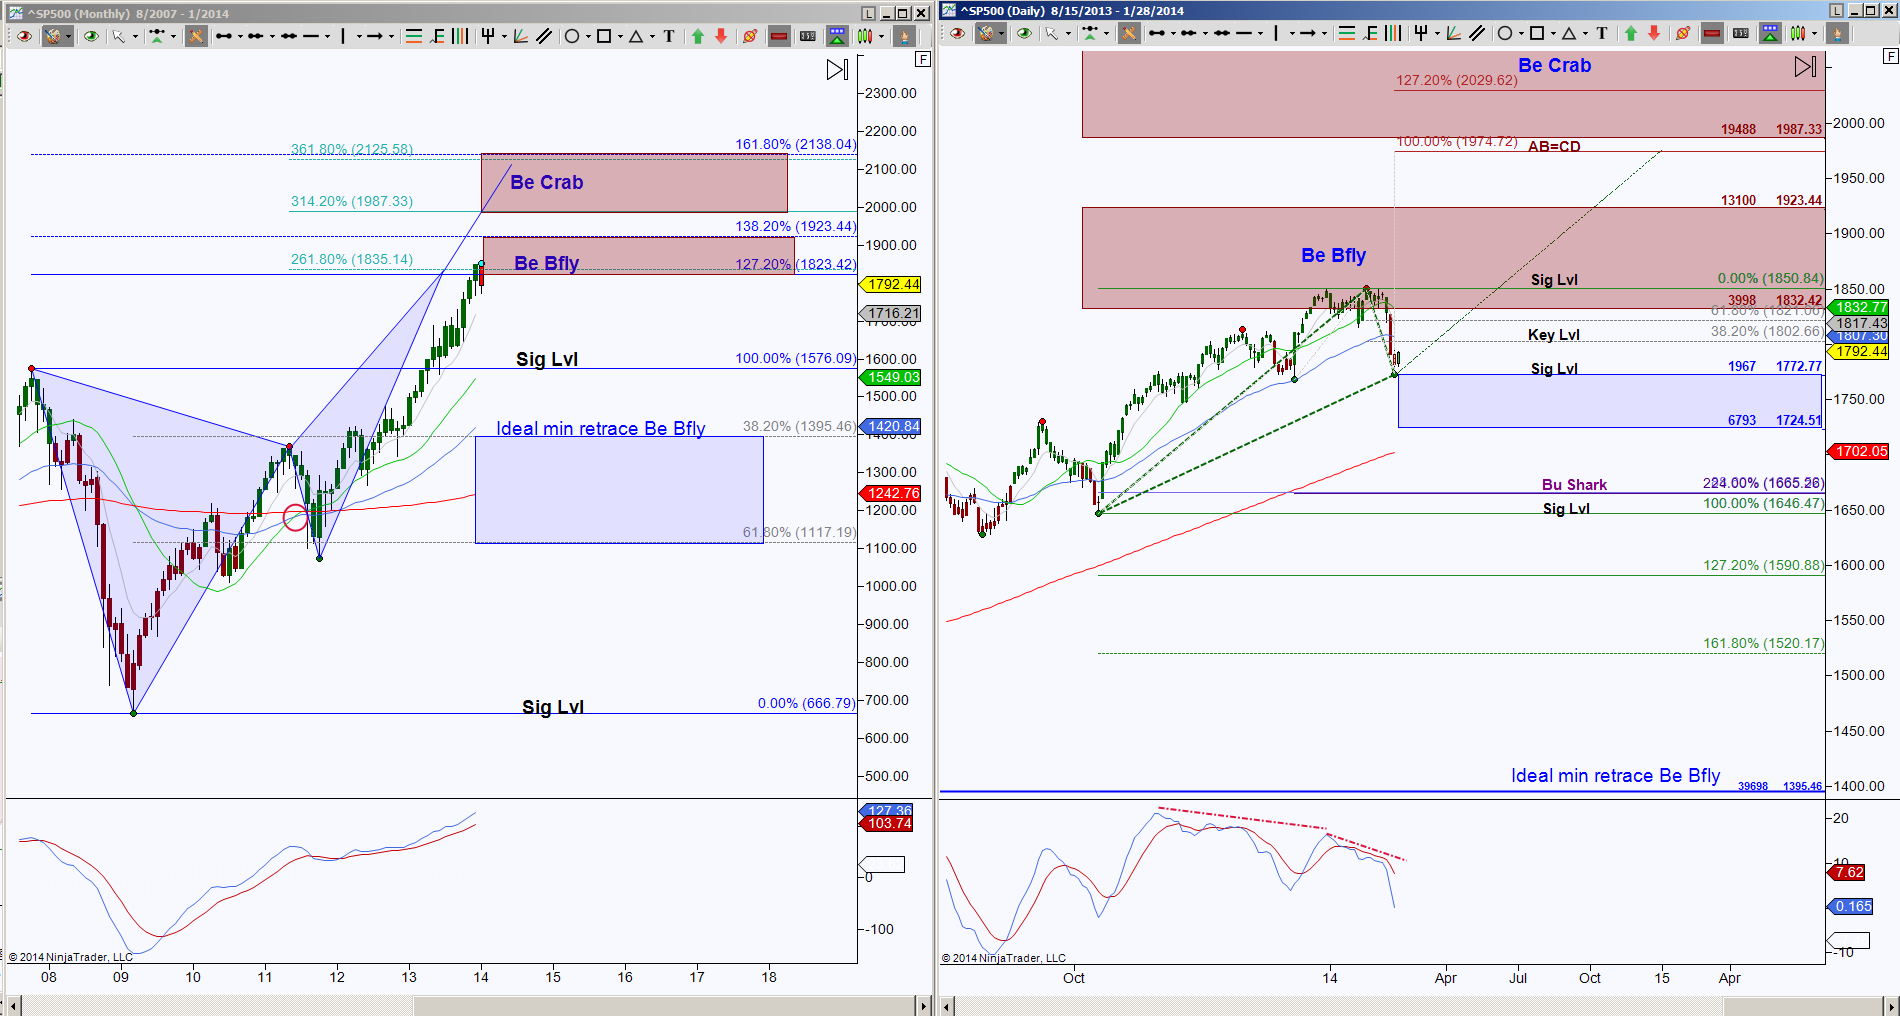
THEN, as posted at MrTopStep blog on January 29, 2014, I was watching if S&P 500 (aka SPX) bearish pattern would go into retracement mode since there was divergence and after all, price had completed a bearish pattern at 1850.84 and had pulled back below the PRZ support level 1832.42. Then the ideal minimum retracement target was 1395.46 but there was important support levels at 1772.77, 1724.51 and 1665.28.
To quote that January 29th article, “The outcome of one of these opposing patterns completing will help determine the probability of retracement mode of the monthly Bearish Butterfly, or attempt to test all levels in the PRZ or even seek the levels of the extended PRZ for the Bearish Crab.” I was also looking for upside continuation should price take out 1850.84, with targets at 1923.44 and 1974.72, in route to the next PRZ targets 1987.33 to 2138.

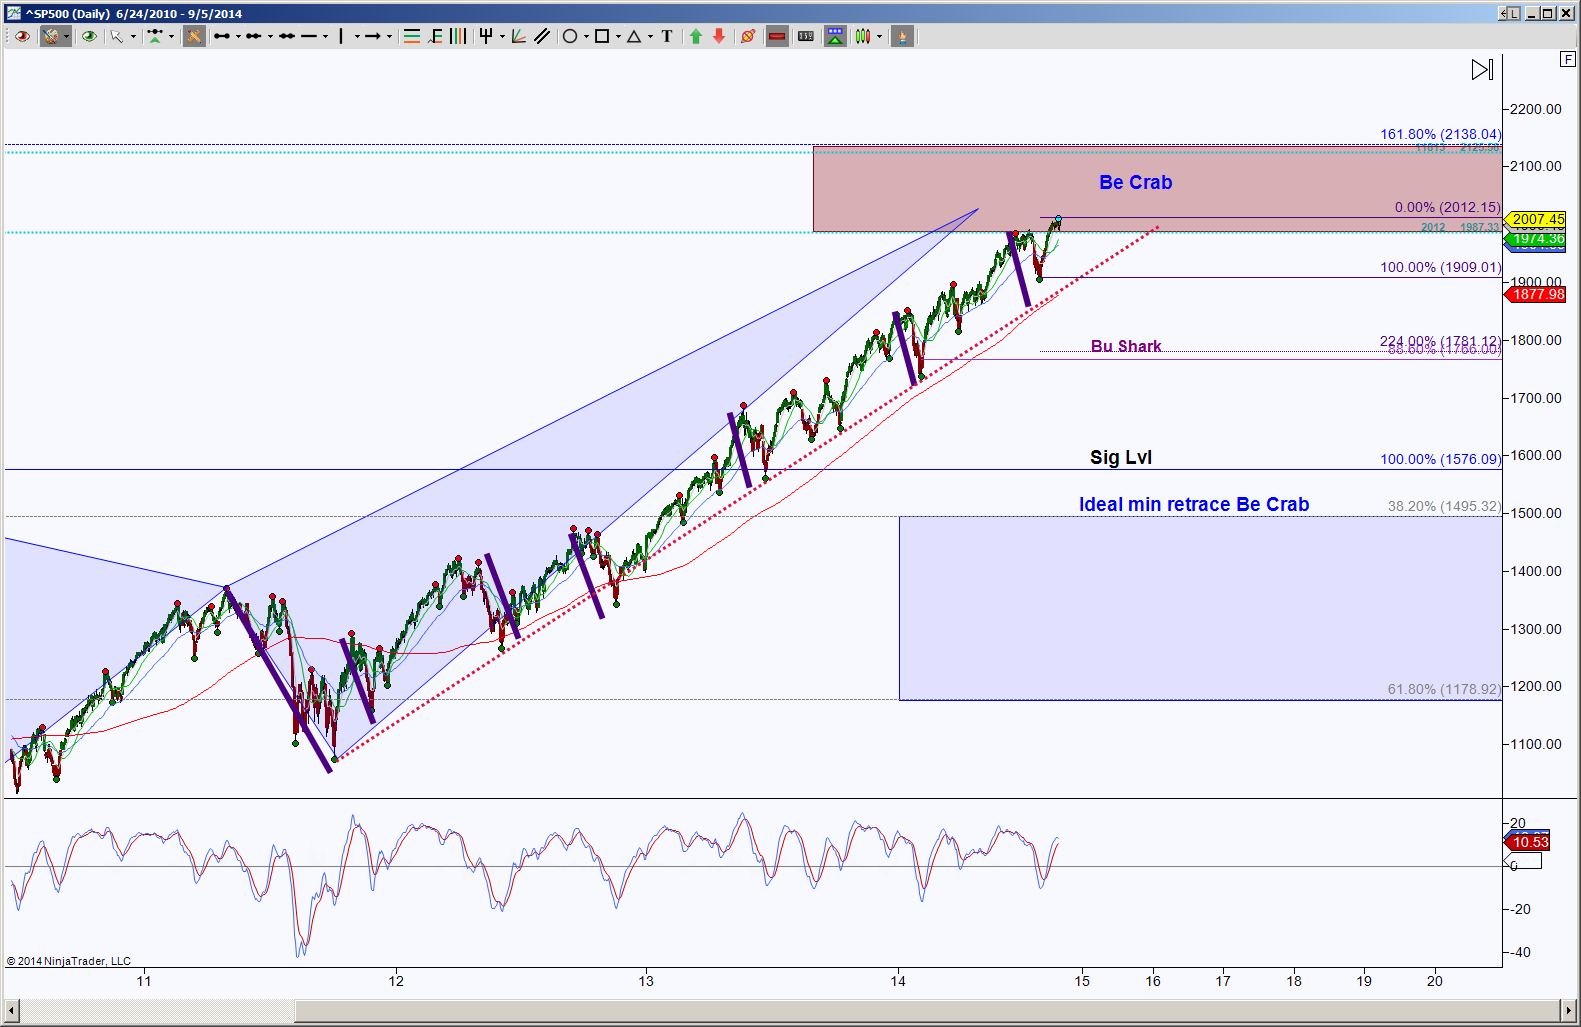
NOW, price is inside the extended bearish Crab PRZ, in other words, price has reached the 1987.33 target to complete the pattern. Currently this day chart shows there’s potential pull back to 1974.36 or to the confluence support test 1909.01 region. This will be a very important support test and a hold below there shifts the current strength of the upside bias. There are some clues that these higher highs are sputtering in momentum, note how progressively the pull backs (as shown in purple lines) have progressively decreased as price approached the extended PRZ.
A hold below 1987.33 increases the probability of testing 1909.01, below there increases the probability of going into retracement mode. The ideal minimum retracement target is 1495.32 and the ideal retracement target remains at 666.79. There is s small pattern completion target at 1781, so a hold below 1909 has this area for scaling a short position, protecting it or prepare to exit due to bounce potential.
A hold above 1987.33 implies an attempt to test the top of the PRZ at 2138.04, beyond there will require new Fibonacci extensions.
