On June 17, 2014, I co-wrote an article with Randall Liss regarding an analysis for USDJPY harmonics and binaries, which was posted at MrTopStep site
So this is a follow up on the intraday perspective for the harmonic scenario.
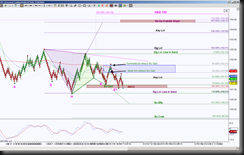
 THEN I was looking for a second right shoulder at the completion of a Bullish Gartley at the 101.23 region. Price was in between opposing emerging patterns with line in the sand levels at 102.79 & 100.81.
 NOW price has completed the Bullish Gartley, and has breached the 101.23 to complete another harmonic pattern, ABCD at 101.09. There are different ways to trade harmonic patterns, but I like to trade the final leg and the completion, so when price bounced off the 101.57 Significant Level to form the 3rd of 4 legs, that’s when I would be stalking a short for the final leg to 101.23, then would have stalked a long opportunity at the completion of the Gartley.
Without being complicated to those unfamiliar with harmonic rotations, simply put, my strategy based off my triggers, there was a short opportunity around 101.6 to target of 101.23, then a long opportunity from 101.37 to targets 101.86 and 102.21, all of these targets being fulfilled.
Price is currently at a decision point, either to validate the inverse H&S scenario by going into retracement mode aka upside move, or invalidate the H&S scenario by testing the 100.81 line in sand level, it will be at this juncture that there will be another decision point. How to trade it from here? A conservative approach is to wait for a close and test beyond the PRZ levels 101.23 or 101.09 or more conservative entry would be a hold or breakdown of 100.81. Price is still in between opposing emerging patterns with downside bias but note that price is not committed to holding neither above 101.23 or below 101.09 at this time.
Since I see downside bias, I would rather wait for a rejection of 101.57 or close and hold below 100.81 for a short opportunity to the ideal target of 99.59 and scaling point at 100.27. My bias would shift with a hold above 101.57 which then I could stalk a long opportunity to fulfill the inverse H&S with ideal target of 104.79 an scaling points at the gray, green and purple fibs with emphasis at 103.01 and 104.37.
