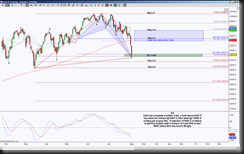
 THEN on August 1, 2014, I was looking at the daily DAX chart and was looking to see how much a small bullish Crab would retrace with the ideal minimum target at 9497.5 and ideal target of 10056 as well as downside targets of 9069, 8942, 8939 and 8253.5 should 9180.5 fail to hold as support.
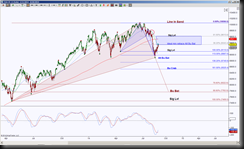
 IN BETWEEN, the two patterns I was watching were compromised according to my harmonic rules and guidelines. These particular patterns did offer me downside targets when the Crab PRZ was breached. However due to the shift in harmonic pattern relationships, I created new rotations and wrote about it August 20, 2014 in MrTopStep blog. It was at this juncture I had new harmonic patterns playing out and I was watching if price would hold below or above 9343.5.
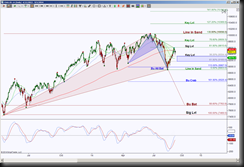
 NOW, the first day of September, that Alternate Bullish Bat has retraced 61.8% after pushing above the 9343.5 level. There’s a new guy peeping it’s triangular head in the picture, which I’ve colored green, this one requires at least a pull back to 9334.5 to hold its own, as it stands.
So this is what the current events for DAX and harmonic rotations are offering. My first question is whether 9334.5 will be tested and if so will it be able to hold, if not, then price has the next ideal target of 8903 and scaling points at 9169.5 and 8987. If price does pull back to 9334.5 but holds then there’s an ideal target of 9809.5 and scaling point at 9615.5. If price does not pull back to 9334.5 then 9809.5 is still an upside target providing 9615.5 fails to hold as resistance but it changes the dynamics of that green pattern scenario.
A lot of “if’s”? You could look at it that way OR I prefer to look at it as having liquidity in bias, and since there’s no edge for me to jump into a trade where currently price is, then the judgement call for me is to wait (yes, that patience part of trading) for price to reach the levels I deem as directional bias tests, then decide on a trade based on that information.
