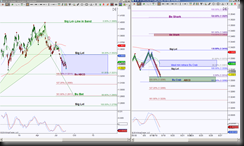
 THEN, last week, a post dated 8/20/14 displayed this chart and stated that 6E has downside bias and how I was watching price behavior at 1.3314 then 1.3295 as initial support test targets, that there an ideal target at 1.2900 but a confluence target at 1.3231 to 1.3214 zone.
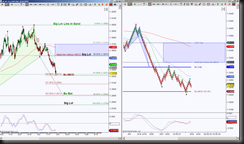
 NOW, if a short position was taken, price is at a scaling or exit point because it has reached the confluence target of the 1.3231 to 1.3214 zone. The right chart shows that this is also an ABCD PRZ and this pattern will be the initial pattern to see if there’s a retracement attempt. So far it remains in bearish bias but to lock in profits from a short position a stop could be above 1.3269 because above there increases the probability of retracement attempt to its ideal minimum retracement target of 1.3308 and ideal target of 1.3447, if price cannot hold above 1.3269 or fails to test or push through 1.3308, the probability is for downside continuation to the next target of 1.2900.
If the smaller ABCD (right chart) goes into retracement mode and can hold above 1.3308, this increases the probability of retracing the larger (left chart) ABCD with its ideal minimum target of 1.3523 and ideal target of 1.3995.
