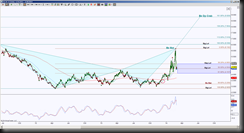
NGJ14 completed a daily harmonic pattern called a Bearish Bat, and has been in retracement mode. So far this retracement is considered shallow, and price is stalling in the middle of a GRZ (Golden Ratio Zone aka the area between 38.2% and 61.8% Fibonacci Ratios).
 The Day chart shows there is confluence at that 50% pull back region, this is also the last chance to validate a bullish cross of moving averages. So a hold at this 50 ema and 50% fib ratio at 4.504 offers a long opportunity to test the top of the GRZ at 4.900, keeps the upside bias and implies a retest attempt of 6.182.
A hold above 6.182 has the ideal upside target of 8.829 and scaling points (aka potential rejection points) at 7.018 and 7.954.
A hold below 4.504 shifts the bias to downside, to continue the retracement mode with the ideal target of 2.825 and scaling points at 4.107 and 3.208.
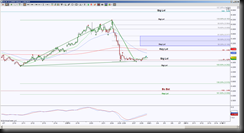
 To help determine clues as to what is happening at this daily level 4.504, I’m looking at a 10,000 volume chart with the nearby daily levels marked in large font on this chart. This shows there is a slight upside bias with the initial resistance test at 4.801, a potential breach to test the daily 4.900 level but harmonically speaking, a test of 5.106 minimum is a required bounce point.
Failure to get to that 5.106 target, or a rejection of 4.801 or 4.900 increases the probability of retracement mode.
Success of testing 5.106 becomes a level of importance in regards to the GRZ. A hold above 5.106 has the ideal target at 6.182 and the gray fibs along the way as potential rejection levels with emphasis at 5.517. A test and rejection of 5.106 has the ideal downside target at 3.059 which has correlation with the daily Bullish Bat PRZ (Potential Reversal Zone aka harmonic pattern completion zone).
