Harmonics and Fibonacci’s are fractals, thus they offer an interpretation of price action, and this first chart is clear to a harmonic pattern trader, that smaller harmonics are helping larger harmonics play out.
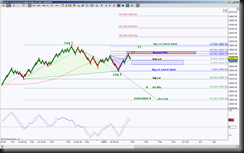
 On Monday, July 28th, I took a snap of an NQ STRenko 16 Bar size chart, and saw the chart having an upside bias with a pull back into support scenario. The bigger picture of this intraday perspective chart shows that price is forming the third of four legs for the green colored pattern, the maximum this leg can go in the world of harmonics is 3991.25. I noted with the number 3 and question mark, that the rejection of the Bearish PRZ . The clue will be whether price holds above or below 3954.50, this is the initial pull back target.
The primary levels were 3975.75, 3991.25 to the upside and 3954.50 as the initial level for the downside support test target.
As long as price holds above 3954.50, the bias remains to the upside with the last chance to validate the third leg at 3991.25. Below 3929 tremendously increases the probability of completing the fourth and final leg to complete the harmonic pattern, a Bullish Butterfly, at 3887.50.
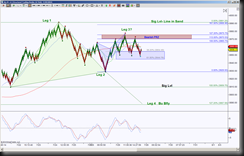
Now let’s see how these harmonic scenarios have unfolded as of the end of day on July 29th.
 This updated chart shows the initial test of the blue Bearish PRZ rejected the level and fell back to the 3954.50 pullback target, then proceeded to test all levels inside the Bearish PRZ, again pulled back to 3954.50 then retested the PRZ once again but this time quickly holding below it rather than retesting the top of the zone, followed by a retest of that 3954.50. The bias has changed from upside with pullback into support scenario to sideways action with some downside bias. I’m still watching for a HOLD below 3954.50 to increase the probability of testing 3944.75 and more importantly 3929.
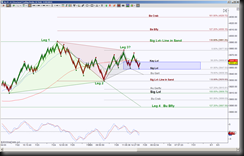
Now I’m going to tweak the chart to show larger rotations, keep in mind the smaller blue pattern helped push price up to find a potential 3rd leg, but now I want to see the larger harmonic scenario.
 So here’s the fine tuned chart which shows price is in between opposing emerging patterns, when this occurs I look for the Line in the Sand levels to hold or not because they are capable of invalidating a pattern. Note how price is not only in between 3977.50 and 3929, but price is also in a tighter range of the GRZ levels 3959 and 3947.50. So these will be the initial levels to hold beyond, then the other targets can come into play. The major targets, harmonically speaking are 3887.5 when price breaks down 3929 and 4029.75 with a break out of 3991.25.
