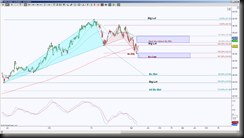
Yahoo found buyers at the completion of a Bullish Butterfly harmonic pattern, the ideal minimum retracement target is 35.21 but there is a level of 34.45 that is the initial resistance test. Harmonic patterns, which are an enhancement of using Fibonacci Ratios, have a way of describing probable targets and the strength of reversal patterns.
 The day chart shows that a bullish pattern completed at 32.27, there are two ways to look at a completion of a harmonic pattern, either they are reversal pattern scenarios or they are a means to an end, meaning their completion helps break through important levels, and they are just targets in route to larger targets or patterns.
The amount of retracement measures the interpretation of whether it’s a target in route or a reversal point. So above 34.45 increases the probability of testing the GRZ which is the ideal minimum retracement target. Unless price can at least hold inside that blue zone, the probability of returning to the Butterfly PRZ of 32.27 or extending to 30.93 increases.
If price can hold above 35.21, the probability of testing the top of the GRZ increases, and once price can break out the other side of the GRZ, in this case 37.09, the probability of having a nice retracement of that bullish pattern increases. Of course every reversal pattern dreams of retracing 100%.
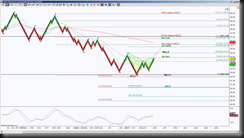
 Since price is in between important levels 34.45 and 32.27, I’ve gone to an intraday perspective, using a 38 STRenko bar size chart, showing those two daily levels and what’s happening inside that area.
This chart shows that there was an ABCD harmonic pattern completion that happens to correlates with the daily Butterfly PRZ at 32 region and that this ABCD is attempting to go into retracement mode also. Side note, when two harmonic patterns merge into one level, the probability of rejection increases, such was the case at the 32 zone.
Currently a small bearish pattern, this one is called a Bearish Gartley’s completion PRZ is at 34.39 and price is approaching that ideal target. This gives us the opportunity to see if this is a target in route to higher targets or if this will prevent price from having a respectable retracement of the ABCD.
A rejection of 34.39 keeps price in a consolidation type formation until the 32.27 can be broke down, if so there is ABCD confluence target at 30.65, note this will push price below the next important level of 30.93 on the daily chart. A hold above 34.39 has dual targets, one the retracement of the ABCD and two the test of the green pattern’s extension targets, both of these have zones at 36 and 36.8 regions. Note that there is heavy confluence at the 36.76 to 37.09 region, this becomes a magnet if momentum increases to the upside as well as a potential rejection point once there.
So is the daily Bullish Butterfly and the intraday Bullish ABCD offer a large upside move by going into retracement mode? Each important level is noted on the charts representing harmonic significance, and each level that price can push above it, increases the probability of upside bias, with 37.09 being the toughest level to break at this juncture.
