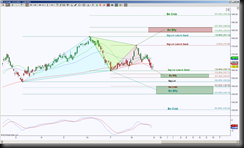
GS is in between opposing emerging patterns both on day and intraday charts interpreted as indecision. The great thing about harmonic patterns is they offer important levels to break and hold beyond and once that occurs, what the targets are.
 Day chart shows price is approaching a line in the sand levels for one of the opposing emerging patterns at 159.77, what happens there determines if a pattern gets eliminated and which has a higher probability of playing out.
A hold above 159.77 keeps price in a sideways range until can break above 175.59, if so the ideal target is 194.33 and scaling points (aka potential rejection/reversal levels) at 181.13, 183.91 and 186.94.
A hold below 159.77 has an ideal target at double PRZ target 149.99 to 145.13, downside continuation extended target is 135.34.
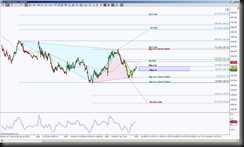
 To view what’s happening inside the blue circle on the day chart to see if there’s some help in direction, I’ve chosen a 10,000 volume intraday chart. This shows the current bias is to the upside, although there is still opposing emerging patterns indicative of sideways range or indecision.
Currently price is inside a small GRZ offering initial levels to break and hold. Above 162.45 has initial important harmonic pattern PRZ target at 162.95, upside continuation from there has extended target 164.32, this will help test one of the line in the sand levels on this intraday perspective. A hold above 164.32 has the ideal target at 167.75 and scaling points at the cyan Fibonacci ratios.
A hold below 162 has two line in the sand level targets at 161.29 and 160.77, a hold below there has the ideal target at 158.66 and scaling point 159.46. The completion test of 158.66 will help the daily chart target of 157.71 increase in probability.
