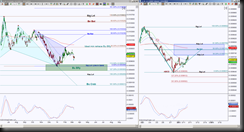
An update to a previous post regarding 6JH13. In the previous post there was a shallow retracement, since then the retracement level of .009935 has not been breached, but rather a pullback from that level in an attempt to retest the bullish Butterfly PRZ (Potential Reversal Zone aka a harmonic completion zone).
There are two emerging Bats that are calling on price to push to the upside for completion, and the day chart shows downside bias. However the intraday chart, in this instance a 10k volume chart is in retracement mode of a bullish ABCD harmonic pattern and is fast approaching the ideal minimum retracement target of .009731.
 Looking at the charts side by side, it’s evident to see the intraday chart is attempting to do two things, test the GRZ (Golden Ratio Zone aka the area between the 38.2% and 61.8% Fibonacci ratio levels) and complete an emerging 5-0 pattern, while retracing a bullish ABCD pattern.
Failure to test .009731 or better yet a rejection of .009760 offers intraday downside bias to be in confluence with the bigger picture.
Providing price retests .009486 is very important, because as long as it can hold (harmonically speaking it cannot breach it by even a tick), those Bats remain in play, and the probability of completing them increases with each important resistance that is taken out such as .009760, .009788 and most impressively .009935.
A break down of .009486 says goodbye to the Bats and hello to the large Crab that has a completion target at .009031, with points of interest along the way at .009380 and .009269.
