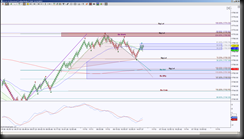
If I had no knowledge of Harmonic Patterns and saw this ES_F chart, I would raise an eyebrow and have to wonder how this is beneficial to me, in fact, I would most likely find it intimidating and disregard the concept.

Harmonic patterns offer symmetrical moves, define risk, targets and exits but if I don’t understand the foundation of the whole Harmonic concept, then I would either need to seek a mentor to learn it in a structured manner or find another means of interpreting the charts, void of Harmonics.
When one grasps the “aha” moment of Harmonic patterns, there’s no turning back. Of course it’s not for everyone, trading methodology is as personal as choosing what clothes to wear, car to drive and food to eat.
But suppose I said the basic Harmonic pattern was as easy as the ABC’s, well in Harmonic language, it’s ABCD’s! Looking at this ES_F chart, I would find it intriguing, inviting and worthy of my time.

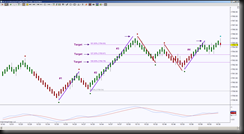
The #1 low to high move, I just copied and pasted the trendline to other lows and there was symmetry in future low to high movements offering targets in advance. Even when it exceeded the measured move, it was pretty much double the #1 move. This occurrence did not just happen once, but four times. Another means of determining symmetrical targets is using the Fibonacci Extension tool, measuring the low to the high and projecting it from the next low. I like to use 100%, 127.2% and 161.8%.
Notice how #2 equals the 100% target and #3 was similar to 161.8% target. It’s not shown but the 200% would match the top of #3.
Also look at the #3 high, that red dot to the green dot did two things, it retested the 100% target from the opposite direction as the #2 upside target and when copied and pasted the red trendline from the next red dot high, the next green dot low was pretty spot on.
So far does that change the original bias of non-beneficial and intimidating to interesting, intriguing and worth learning?
Let’s go one more step and look at the Harmonic Triangle.
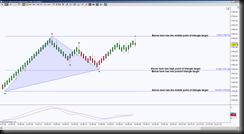
This is the beginning three points of most Harmonic patterns. This offers three points of interest that I like to call Significant Levels because they become important support and resistance as well as magnets.
The basic use of these points of the triangle is, if price is above the middle point the ideal target is the high point. If price is below the middle point the ideal target is the low point and in both instances the risk is on the other side of the middle point. And if price fails to push above the high point or below the low point the ideal target is the middle point.
Now go back and look at the initial chart showing the different Harmonic rotations, it might look a bit more understandable, if not, then just observe how symmetrical movement occurs repeatedly on all instruments. Or practice drawing triangles from a high, low and retracement and watch how those three points are significant levels. If you don’t have a triangle drawing tool that is available in Ninja Trader, you can use trendlines to outline he triangles.

