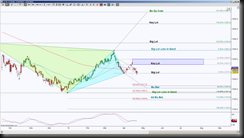
GCM14 has a bigger picture and intraday ABCD pattern which will help other harmonic patterns play out. In a previous post chart, I was watching how price would react to the test of a key level of 1322.7, there was a bit of a breach inside the GRZ before rejecting it to test the significant level of 1279.1. So this is the level I’m watching for price behavior. Currently the bias is to the downside, that bias increases with a hold below this level of 1279.1.
 The day chart perspective shows that a hold below 1279.1 has an ABCD target of 1217.2, this helps price connect to the Bullish Bat harmonic pattern’s PRZ. Also note that the ABCD extension targets as shown in the brown fibs correlate with a significant level and line in the sand for an opposing pattern, and the extended harmonic pattern, an Alternate Bullish Bat. So a trader new to harmonics, this is a great example how just understanding ABCD patterns are beneficial in testing more advanced harmonic pattern targets, and this is the norm rather than the exception.
Momentum implies downside bias on this chart, it’ll be interesting to see how the momentum changes at these downside levels, if tested. This means large green bars, momentum indicators turning to the upside rather than towards the downside as this chart shows in the sub graph.
Of course failure to hold below 1279.1 keeps price in a sideways range between the key level of 1322.7 and significant level of 1279.1. Then the break and hold of one of these levels offers targets in that break direction. People often ask me what I mean by “and hold” after price breaks a level. What I mean is, if price is to break down 1279.1 and hold, the ideal scenario is to push away from it towards 1217.2, but of course there are instances where price will stall just under that level and the longer price can have closing bars or candles below 1279.1, the stronger that resistance line becomes and it implies it’s “holding” price down.
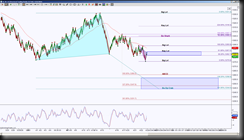
 The intraday chart, in this case an STRenko 16 bar size, shows that there’s a large emerging pattern which has the ideal target of 1244 for its completion, but has a hard time holding below the midpoint of the cyan triangle. Let me intervene here to explain that once the triangle is formed, where price is in relation to the points of the triangle shows the higher probability of directional bias, so in this case, a hold above that midpoint triangle implies an attempt to revisit the highest point, while a hold below that midpoint and more important below the lowest point of the triangle increases the probability of completing this current pattern.
Returning to the chart, there’s a small purple triangle, actually it’s still forming the midpoint but at this juncture there’s some confluence with a key level of 1287 and the current midpoint so I’m using this as an example to show that this small triangle could totally jeopardize the completion of the larger harmonic pattern, but the ideal purple pattern target is 1305 zone and this completion keeps the day chart sideways range in tact. It’s not until price can fulfill the intraday ABCD at 1260.5 does it help price push below that significant level of 1279.1 on the day chart.
Simply put, if the ABCD patterns complete on both of these charts, the probability increases for price to test 1244, 1217.2, 1181.4 and 1153.9. The extreme price is always the ideal price, so each level that fails to create a significant bounce, makes a statement regarding the ideal target of 1153.9 being visited.
