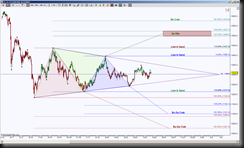
Gold Futures is in between multiple opposing emerging harmonic patterns, forming a wedge formation. This is indicative of this instrument holding its breath while in contraction mode, a valid break of the wedge behaves like the exhale. This formation was created after a bearish move that began in October 2012 to the low of 1183.8, then end of June 2013. This type of consolidation is typically the introduction to a shift in bias, however the expansion can generate in either direction.
 This scenario is based off the day chart, which shows that price is overall in a wedge as shown with the purple dots. The apex of this wedge is 1303 which offers a neutral zone, a hold above it implies a test of the top of the triangular formation, below the 1303 implies a test of the lower trendline of the wedge. Opposing emerging harmonic patterns is also indicative of contraction, there are other patterns inside the ones showing but as fractals are, those smaller patterns have targets that already correlate with existing levels on the chart.
Until price can close and hold beyond the wedge, contraction mode is the probable continuation. Once price exhales and pushes beyond the contraction trendlines, then the Line in Sand levels become the next important areas to test. An upside break has the initial target of 1396.3, above here invalidates the brown colored Bullish Deep Crab harmonic pattern. The next upside target is 1437.6, above there invalidates the blue colored Bullish Deep Crab pattern and it is at this juncture that the probability of testing either 1498.5 or 1575.9.
A downside break has the initial target of 1213.8, below here invalidates the green colored Bearish Butterfly and Crab patterns. The next support test target is 1183.8, below there increases the probability of testing 1101 and 1027.
For now, watch the 1303 level and where price is in relation to it. This will offer a clue which side of the wedge has a probability of being tested, which then has an opportunity for a break out attempt.
