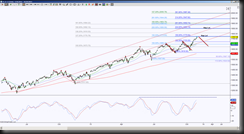
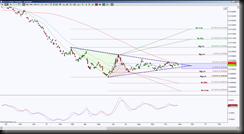
Some traders like to watch correlation between ESZ13 (S&P Emini futures) and 6JZ13 (Japanese Yen futures). So let’s take a look at both. S&P continues to move to the upside with symmetrical pullbacks since the October 2012 bounce off of 1317. The Yen has fallen mercilessly since October 2012 however, is failing to continue to make lower lows since the May 2013 low of 0.009648. So these two instruments had correlation in the opposite direction until May to June 2013, then they began behaving in a divergence style of movement.
First, the ESZ13 daily chart shows price keeps making higher highs and lower lows while holding inside a Pitchfork channel. That sentence is the definition of an uptrend. But as a chart analyst, I seek other clues than the obvious. Until July 2013, price had held way above the Pitchfork channel support line, at this time price breached below the channel line for one day, then continued to reach a new high. The next test of the same Pitchfork channel support line, it breached below it further and held below the line for several days before pushing back above the channel line and again make a new high. But notice this new high fell short of reaching the Pitchfork midline. The most recent test of the channel support line was October 2013, a more distinct push below the support but again failed to hold below the support. So this is a subtle statement of “even though price is making higher highs, there are increasing efforts to push below an annual support line and the highs are struggling at best to reach the midline of the channel. Does this mean price is going to go down now and there’s no further upside targets? Absolutely not, but it does suggest to be aware of how price behaves with another test of the channel support line.
So on that note, technical analysis suggests that a hold above 1775.75, this is a confluence region, there are upside targets derived from Fibonacci extensions and ABCD harmonic pattern targets. When different rotations have levels that meld together at a specific region, then it becomes a magnet and an important test for either support or resistance, in this case, resistance. A hold below 1775.75 implies a pullback to test the channel support line, note if the symmetrical pullback scenario continues, price will push further below the channel support and the target is 1673.75 area. It will be important if price gets to the 1673.75, if it bounces from there or fails to hold there, so that is a definite area to protect any profits if already in a short position.
Now let’s look at the Yen, before October 2012, price began to fall. Then in May 2013, price failed to make lower lows but has continued to make lower highs and thus began a contraction mode in the shape of a triangle. This is a bit different than S&P that has continued to make higher highs and higher lows. So is the Yen making a statement that it has lost the momentum to continue to the downside and will that have an impact on S&P’s upside continuation? Well, there’s no crystal balls concerning the markets, only probabilities. Here’s the thing about triangles, they can literally breakout in either direction, and once there is a break, it is typical for a return to the breakout point to verify it is a true breakout. Now generally speaking, it is a raising of the eyebrow when a move begins to stall and consolidates, it is considered a yellow flag for directional bias. The fact that the Yen is contracting into an apex, similar to it holding its breath, at some point there comes the time for expansion or exhale per say.
The apex is approaching, this is where the triangle support and resistance lines meet so a break above or below the triangle lines are an initial clue of bias, a retest and hold increases the probability of continuation in that break direction. Keep in mind that triangles are typically inside a sideways range, so the triangle is the initial break. In this case the Yen has opposing emerging harmonic patterns and the determining levels are either above 0.010656 or below 0.009648. Above 0.010656 invalidates the brown Butterfly/Crab harmonic pattern, a hold above there has the ideal target at 0.011819 and scaling points at green fibs. Below 0.009648 invalidates the green Butterfly/Crab harmonic pattern and has the ideal targett at 0.009025 with scaling points at the brown fibs.


