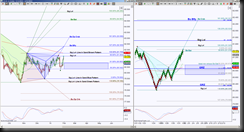
DX_F is currently testing a potential rejection point due to an intraday Bearish Bat harmonic pattern, how much retracement, or failure to retrace, offers a simple method of probable bias. After all, probabilities are a trader’s edge. There’s no 100% guarantee of knowing a particular price movement, not legally anyway.
This US Dollar chart shows the Day timeframe perspective on the left, which offers larger targets, larger harmonic pattern scenarios and Do-Or-Die levels regarding these patterns. The right side is what I use for an intraday perspective, it’s an STRenko bar size that was created strictly for my analysis but personal preference from an individual trader varies in this regard.
 The day chart has colorful triangles that represent different harmonic patterns, if you take a closer look, triangle colors coordinate with the same color fib and text for that harmonic pattern. All of these triangles could look confusing but in actuality, this is a visual of what price action looks like harmonically, when price is in a sideways consolidation. There’s even more patterns inside the ones showing but I figured I’ve made my point with what’s showing.
So the day chart has a very interesting story regarding the blue harmonic pattern, in that originally there was an emerging Butterfly as shown with the dashed lines, the completion target for this Butterfly is 82.305. Due to specific rotations this blue pattern has emerged into a pattern that has a higher completion target at 83.068 for a Deep Crab.
Typically I would remove this original pattern but if you’ll look at on the left side (the past) of your own daily chart of DX, you’ll see that this price of 82.305 has been recognized multiple times as both support and resistance. Then I looked at the intraday chart that shows an extended target for my cyan pattern at 82.331, so I decided to leave it up as a valid upside target and potential rejection point.
Now here’s the simple definition of price action based on the multiple harmonic patterns on the bigger picture and the one harmonic pattern on the intraday perspective. The intraday chart shows upside bias both in momentum and green bars, HOWEVER price is now at a completion target for a bearish pattern, which of course implies that if it’s a valid bearish pattern, this is a rejection point, if it was merely an means to an end, it’s considered a scaling point en route to higher targets.
It’s interesting that this intraday PRZ (Potential Reversal Zone aka harmonic pattern completion zone) at 81.376 matches the solid blue triangle point at 81.454, this offers a stronger level that is being tested, and a hold below here offers a short opportunity to the ideal minimum retracement target at 80.974, this also helps price retest the daily GRZ (Golden Ratio Zone aka the area between the Fibonacci levels 38.2% and 61.8%), AND a symmetrical retracement of the intraday Bat matches the bottom of the daily GRZ at 80.359.
So that’s the scenario IF price rejects this confluence resistance level of 81.440. What IF price cannot even get to 80.974 but rather holds above 81.440 and more important above 81.705? A hold above 81.440 offers a long opportunity to the line in the sand level 81.705 from the daily chart, this is also a significant level because it is a triangle point for the green, brown and blue harmonic patterns, above here makes a bullish statement and increases the probability of upside continuation to complete one if not all of the emerging harmonic patterns.
There’s intraday and bigger picture correlation both to the upside and downside, initial levels to break and hold for probability bias is either 81.440 or 80.974, after that, follow the harmonics!
