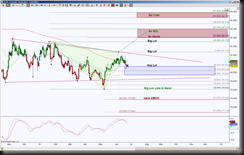
US Dollar index currently testing a support region of 80.354 that has confluence using different means of finding support and resistance. Price has been in a daily wedge since November 2013 and this support currently being tested correlates with the mid point of this wedge, along with last opportunity to validate a bullish cross, and a GRZ.
 This day chart shows price stalling at 80.354, a hold below it implies a test of the wedge support, a hold above 80.354 implies a test of the wedge resistance, so this is considered a line in the sand. Once price can break and hold beyond the wedge, there are harmonic pattern PRZ targets. Let’s play out the hold above 80.354 scenario, the initial resistance test is 80.594 due to a fast and a slow moving average forming a ceiling, so a long position has an opportunity to scale a portion of the position or tighten the position in case the ceiling doesn’t open up. If you’ve read my analysis before, I like to use the scenario based off “If price does this, then that is the probability”, so if price pushes through that moving average resistance, then the top of the wedge is the next upside target for either a scale, an exit or a protection region of an existing long. Once price can hold above the wedge, by this I mean a candle close above the magenta trendline followed by a stall above there or push above there, aka not falling back inside the wedge, then the ideal target is a double PRZ, meaning two totally separate harmonic patterns finding completion in a zone, offering a stronger resistance level. This is definitely a place to take a profit or protect a position if long, and if not in a position, can stalk a short opportunity because PRZ stands for Potential Reversal Zone, they have a very high probability of an initial rejection. Strategic methods of trading harmonic patterns differ according to one’s risk tolerance and account size.
I also like to be prepared for an opposite scenario because too many times I’ve been set in my mind with a bias and being unprepared for a different scenario has been a very costly education. So, a hold below 80.354, this being a GRZ level, increases the probability of testing the bottom of the GRZ as shown with the blue rectangle, at 79.851, this helps price get closer to the wedge support line. A break down of the wedge has the double bottom target of 79.035, a hold below there has a harmonic pattern target comprised of ideal symmetrical movement at 78.454. Symmetry, Fibonacci’s and measured movements are what I love about harmonic patterns.
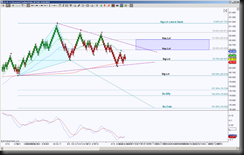
 To get a jump start on how price is behaving at this 80.354 level, I like to go to a smaller view, in this case, I’m using an STRenko 20 bar chart. I find it interesting that this smaller view also has a wedge formation while testing a significant level which also has moving average confluence. The 80.367 is the point of the triangle which is necessary in a harmonic pattern rotation also has the 200 moving average and the wedge support line. So the break and hold of this smaller wedge offers an increased probability of the break at the 80.354 daily line in the sand.
A break down of the intraday wedge has an ideal target of 79.332 and scaling points at the cyan fibs, but notice how the completion of the bullish Crab at 79.332 helps price push below the daily wedge support. This has a two-fold purpose, one, to get price below that wedge, and two, the completion of the intraday harmonic pattern offers an opportunity to bounce into that breakdown point for a validation test.
A hold above 80.367 has the initial resistance test at 80.556, then the wedge resistance line, a breakout there has the ideal target at 81.170 and scaling points at the GRZ and 80.971. The intraday GRZ helps test the daily wedge resistance line, and a double top of 81.170 breaches the wedge, it will be important to see if that is indeed a breach or a valid breakout, a validity is a pull back to test the trendline and it holds. Once price can hold above 81.170, the probability increases to test that double PRZ on the day chart that starts at 82.012.
