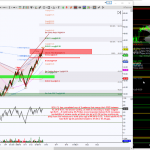
The stock charts posted so far this wk have same harmonic scenario if there’s no updated chart. The Day Swordlines for ES, NQ, CL, GC futures & SPY can be refreshed using the STLevels indicator. These charts may just show … Continue reading
Category Archives: Patterns
Premium Preview: APPL At Core Of Bearish Gartley
Gallery
Day chart of $AAPL is stalling inside the core or PRZ (Potential Reversal Zone aka a region where a harmonic pattern completes) of a Bearish Gartley. The initial levels to break and hold are either above 109.78 or below 107.49. … Continue reading
Premium Preview: GC_F Flipped A Coin, It’s Tails
Gallery
GC_F Day chart shows price completed a bearish harmonic pattern, called a Shark at 1386.6, then flipped a coin while in a triangular formation and Friday’s close below the triangle says “it’s tails”. A valid breakdown of the triangle, aka should … Continue reading
Premium Harmonic Charts for the week of 08/22/2016
Gallery
There are swing charts for some stocks included. Some members only trade futures, others stocks or ETF’s. It’s not meant for an individual to trade all these instruments at once, but rather choose favorites. The best trades are those that … Continue reading
Premium Harmonic Intraday Trading Charts for 08/19/2016
Gallery
The stock charts posted so far this wk have same harmonic scenario if there’s no updated chart. The Day Swordlines for ES, NQ, CL, GC futures & SPY can be refreshed using the STLevels indicator. These charts may just … Continue reading
Premium Harmonic Intraday Trading Charts for 08/18/2016
Gallery
Revised CL chart with Oct STLevels: The stock charts posted so far this wk have same harmonic scenario if there’s no updated chart. The Day Swordlines for ES, NQ, CL, GC futures & SPY can be refreshed using the STLevels … Continue reading
Premium Harmonic Intraday Trading Charts for 08/17/2016
Gallery

This gallery contains 1 photo.
The stock charts posted so far this wk have same harmonic scenario if there’s no updated chart. The Day Swordlines for ES, NQ, CL, GC futures & SPY can be refreshed using the STLevels indicator. These charts may just show … Continue reading
Premium Preview: Crude Out Of Crud?
Gallery
Oil futures composite chart shows price has removed itself from a range between 43.58 to 39.19 while day chart shows price is in Retrace Mode of a bullish pattern as shown in green. There’s some notations on the chart that reflect … Continue reading
Premium Harmonic Intraday Trading Charts for 08/16/2016
Gallery
The stock charts posted so far this wk have same harmonic scenario if there’s no updated chart. The Day Swordlines for ES, NQ, CL, GC futures & SPY can be refreshed using the STLevels indicator. These charts may just show … Continue reading
Premium Harmonic Charts for the week of 08/15/2016
Gallery
There are swing charts for some stocks included. Some members only trade futures, others stocks or ETF’s. It’s not meant for an individual to trade all these instruments at once, but rather choose favorites. The best trades are those that … Continue reading
