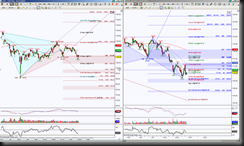
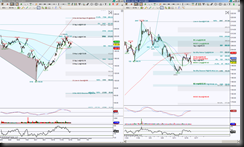
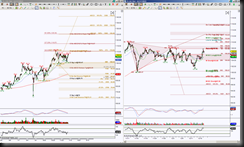
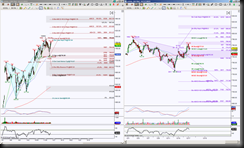
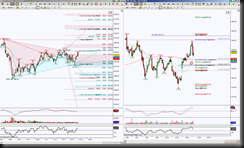
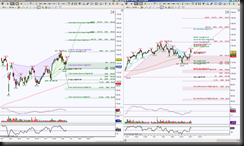
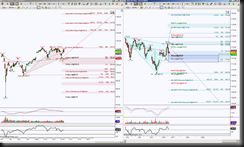
This is a short week due to Christmas holiday. Updated intraday charts will only be posted for Monday, Tuesday & Wednesday. Enjoy your family and friends, Happy Holidays! I’m having some technical issues w/ some of my STHarmonic levels showing … Continue reading
Category Archives: Charts
Premium Harmonic Charts for the week of 12/21/2015
Gallery
This is a short week due to Christmas holiday. Updated intraday charts will only be posted for Monday, Tuesday & Wednesday. Enjoy your family and friends, Happy Holidays! There are swing charts for some stocks included. Some members only trade … Continue reading
Premium Harmonic Intraday Trading Charts for 12/18/2015
Gallery
I’m having some technical issues w/ some of my STHarmonic levels showing on some of my charts, if you’re having the same issue, we’re working on it. The stock charts posted so far this wk have same harmonic scenario if … Continue reading
Some Stock/ETF Harmonic Scenarios
Here’s some charts on AAPL, BIDU, FB, GOOGL, IBB, NFLX, QQQ. Each instrument has the Day chart perspective is on the left, the Hour chart is on the right.
Premium Harmonic Intraday Trading Charts for 12/17/2015
Gallery
CL rollover to Feb contract levels The stock charts posted so far this wk have same harmonic scenario if there’s no updated chart. The Day Swordlines for ES, NQ, CL, GC futures & SPY, AAPL, BIDU can be refreshed using … Continue reading
Premium Preview of: Banking Sector, XLF Flies Like A Butterfly
Gallery
XLF, the banking sector ETF, is in a retracement mode of a Bullish Butterfly and approaching a symmetrical target at 24.54. Due to expansion of price, there’s a probable stall or snap back to the initial support test at 24.27 … Continue reading
Premium Harmonic Intraday Trading Charts for 12/16/2015
Gallery
The stock charts posted so far this wk have same harmonic scenario if there’s no updated chart. The Day Swordlines for ES, NQ, CL, GC futures & SPY, AAPL, BIDU can be refreshed using the STLevels indicator. These charts may … Continue reading
Premium Preview of: US Dollar Crab Claws at Ideal Minimum Retrace Target
Gallery
The US Dollar Index, USDX in retracement mode of a bearish harmonic pattern called a Crab and clawing (stalling) at it’s ideal minimum retracement target. First of all, my 1440 minute chart shows there was a purpose for price to … Continue reading
Premium Harmonic Intraday Trading Charts for 12/15/2015
Gallery
The stock charts posted so far this wk have same harmonic scenario if there’s no updated chart. The Day Swordlines for ES, NQ, CL, GC futures & SPY, AAPL, BIDU can be refreshed using the STLevels indicator. These charts may … Continue reading
Premium Harmonic Charts for the week of 12/14/2015
Gallery
STLevel updates for QQQ Day chart and DX_F Hour charts There are swing charts for some stocks included. Some members only trade futures, others stocks or ETF’s. It’s not meant for an individual to trade all these instruments at once, … Continue reading

