There are swing charts for some stocks included. Some members only trade futures, others stocks or ETF’s. It’s not meant for an individual to trade all these instruments at once, but rather choose favorites. The best trades are those that … Continue reading
Category Archives: Charts
Premium Harmonic Intraday Trading Charts for 02/19/2016
Gallery
**Thank you for the prayers & kind words regarding my mom. As I stated she has stage 4 lung cancer, it is terminal, however her most recent scan was good and there is less dense & smaller size due to … Continue reading
Premium Harmonic Charts for the week of 02/15/2016
Gallery
**Two things – My mother has been on chemo for stage 4 lung cancer since October. Her doctor wants to talk to her about an experimental drug and I am travelling Monday to see her and will return on Thursday. … Continue reading
Premium Harmonic Intraday Trading Charts for 02/12/2016
Gallery
The stock charts posted so far this wk have same harmonic scenario if there’s no updated chart. The Day Swordlines for ES, NQ, CL, GC futures & SPY can be refreshed using the STLevels indicator. These charts may just show … Continue reading
Premium Harmonic Intraday Trading Charts for 02/11/2016
Gallery
The stock charts posted so far this wk have same harmonic scenario if there’s no updated chart. The Day Swordlines for ES, NQ, CL, GC futures & SPY can be refreshed using the STLevels indicator. These charts may just show … Continue reading
Premium Harmonic Intraday Trading Charts for 02/10/2016
Gallery
The stock charts posted so far this wk have same harmonic scenario if there’s no updated chart. The Day Swordlines for ES, NQ, CL, GC futures & SPY can be refreshed using the STLevels indicator. These charts may just show … Continue reading
Premium Harmonic Intraday Trading Charts for 02/09/2016
Gallery
The stock charts posted so far this wk have same harmonic scenario if there’s no updated chart. The Day Swordlines for ES, NQ, CL, GC futures & SPY can be refreshed using the STLevels indicator. These charts may just show … Continue reading
Premium Harmonic Charts for the week of 02/08/2016
Gallery
There are swing charts for some stocks included. Some members only trade futures, others stocks or ETF’s. It’s not meant for an individual to trade all these instruments at once, but rather choose favorites. The best trades are those that … Continue reading
Premium Harmonic Intraday Trading Charts for 02/05/2016
Gallery
** I will be travelling back home all day on Friday, so if it takes a while for me to respond to any correspondence, it’s because I don’t have service. If you have a question about a specific chart, please … Continue reading
Premium Preview: Can DAX Wax The Floor With Harmonic Opportunity?
The DAX completed a harmonic pattern at 9760 offering an opportunity for buyers to step in, when they failed to do so it offers the the opportunity for sellers to push lower to extended harmonic pattern targets.
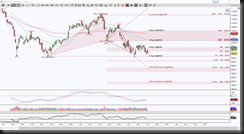
The Day chart shows rather than bouncing with conviction off the brown zone between 9760 & 9546.5, price breached below it to test a previous low of 9303.5, this I call a Significant Level and it is an important one in the world of harmonics. Below it has two ideal targets, 8723.5 and 7985.5. Either of these targets will offer another opportunity for buyers to step in for a retracement mode of a bullish pattern.
The other side of the coin, double bottoms also offer that same buying opportunity, and every buying opportunity level in the DAX needs conviction to invalidate the current bearish cross, in this case, initially above 9760 then more important above 10122.
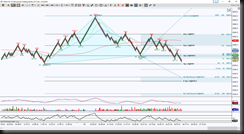
For an intraday perspective, I’m using an STRenko 20 bar chart. I’ve left the Day chart levels on this intraday chart labeled with a D. If price holds below 9387, downside ideal targets are 9232.5 which helps price test the vicinity of the Day Significant Level 9303.5, and the extended ideal target of 9243 would push price below the Day level.
If price is able to hold above the intraday Significant Level 9426.5, the initial important resistance target is 9476 which above there risks shifting the intraday bias to upside, increasing in that probability above 9631.
Trading involves substantial risk and is not suitable for all investors. Past performance is not indicative of future results.


