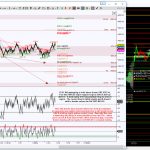
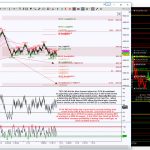
You need the STLevels Swordlines indicator to view this week’s Stocks with Mo STSwordlines: AAPL, GLD, IBB, IWM, QQQ, TF_F (however, if you don’t use the NT indicators & would like to view the levels, please let me know) Mo/Wk/Day … Continue reading
Category Archives: Charts
Premium Harmonic Intraday Trading Charts for 11/17/2016
Gallery
Evidently there’s hard line issues w/ area internet, they just finished working on my home connections a bit ago but it’s taken me a long time to upload charts … still having challenges to upload charts. Due to time restraints … Continue reading
Premium Harmonic Intraday Trading Charts for 11/17/2016
Gallery
I’ve had some internet issues, finally got the charts loaded on this post … sorry for the delay, it’s supposed to be fixed this afternoon. The stock charts posted so far this wk have same harmonic scenario if there’s no … Continue reading
Premium Harmonic Intraday Trading Charts for 11/16/2016
Gallery

This gallery contains 9 photos.
The stock charts posted so far this wk have same harmonic scenario if there’s no updated chart. The Day Swordlines for ES, NQ, CL, GC futures & SPY can be refreshed using the STLevels indicator. These charts may just show … Continue reading
Premium Harmonic Intraday Trading Charts for 11/15/2016
Gallery

This gallery contains 7 photos.
The stock charts posted so far this wk have same harmonic scenario if there’s no updated chart. The Day Swordlines for ES, NQ, CL, GC futures & SPY can be refreshed using the STLevels indicator. These charts may just show … Continue reading
Premium Preview: IBB Be Knockin
Gallery
IBB, the ETF for biotechnology, is in overall decisive mode but knocking at levels that can help decipher bias. The Day chart shows price has been attempting to retrace the green Bullish Gartley and so far has a respectable yet … Continue reading
Premium Preview: ES_F Buyers and Sellers Tapping Their Foot
Gallery
ES_F Day chart shows price is inside a consolidation type formation as well as in between opposing emerging patterns which is also indicative of indecision, thus each side tapping their foot awaiting for price to take out important levels. Currently … Continue reading
Premium Preview: IYF Banking On Harmonic Targets
Gallery
$IYF Day chart shows price is taking out a previous high of 94.18, due to expansion there’s a suggestion of stalling or a pullback into support and the initial pullback target is 94.18 but price could come back to 91.81 … Continue reading
Premium Harmonic Charts for the week of 11/07/2016
Gallery
You need the STLevels Swordlines indicator to view this week’s Stocks with Mo STSwordlines: AAPL, GLD, IBB, IWM, QQQ, TF_F (however, if you don’t use the NT indicators & would like to view the levels, please let me know) Mo/Wk/Day … Continue reading
Premium Harmonic Intraday Trading Charts for 11/11/2016
Gallery
The stock charts posted so far this wk have same harmonic scenario if there’s no updated chart. The Day Swordlines for ES, NQ, CL, GC futures & SPY can be refreshed using the STLevels indicator. These charts may just show … Continue reading
