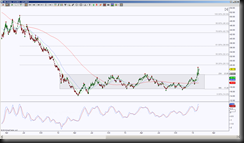
United States Natural Gas fell from a June 2011 high of 50.56 to an April 2012 low of 14.25, before it started its two year sideways range between 23.80 and 17.28. The end of January 2014, there was finally enough upside momentum to push price above this range to form the highest high since that 2012 low, followed by a return to the range breakout point for a support test aka a validation of a break out.
 This day chart of UNG shows the gray consolidation range, the Fibonacci ratio’s from the 50.56 high to the 14.25 low, and how price is seeking upside points of interest. Charts, price action and basic technical analysis tell a story of what an instrument is playing out, understanding the symbology of the story, offers confidence, risk management and a trading plan in general.
For me, Fibonacci ratios offer a great means of pinpointing points of interest, Harmonic Patterns offer a means of determining which Fibonacci ratio has an increased probability of significance. This first chart shows the simplest form of high to low impulsive move followed by a range breakout. It’s at this juncture that a new trader will ask, “Now what?”
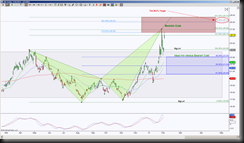
Harmonic Patterns require a 38.2% minimum retracement, so we see that 28.12 is the 38.2% retracement level from the high and low. I’m going to hone in on what occurred prior to the breakout and see if there’s a Harmonic Pattern that will help price attain that minimum ratio target.
 In this chart it shows that indeed there was a Harmonic Pattern, called a Bearish Crab, the formation is visible using the green triangles. The ideal completion target of this pattern is 28.73 but the initial part of the PRZ (Potential Reversal Zone aka the completion region for a Harmonic Pattern) is 26.56. The initial test of the PRZ (the red zone) was rejected, this is when price came back to test that gray range to see if there was any interest in returning to that sideways consolidation.
Price gapped up after retesting the gray range but so far has been unable to 1. retest that 26.96 high and 2. reach the ideal target at the top of the zone. If price can push back inside the PRZ, the probability increases to meet that ideal target and thus reach the 38.2% Fibonacci target at 28.12 derived from that high to low swing retracement.
Strong Harmonic Patterns like to retrace 100% or more, weak retracements are less than 61.8%. So here’s what this Harmonic Pattern’s story is, if price holds below the PRZ, the initial retracement target is 24.09, then the 38.2% retracement target which is 23.05. Note that if price can pull back to this 23.05 level, it brings price back inside the gray consolidation region which could incur more sideways range. However remember weak retracements are less than 61.8% so if price cannot go below 21.82 or 23.05, then the implication is an attempt to retest the PRZ.
Price has been stalling in that gray region as though it were trying to say it was bottoming out, there’s no interest in going further down. This is an opportunity to leave the stall region and seek upside value. A better inclination of this scenario is for price to have a shallow retracement of the Bearish Crab, push above the PRZ 28.73 and proceed upward. The gray fibs on the first chart are targets but once price can hold above 28.73, there will be another Harmonic Pattern in the works that can pinpoint high probability targets and potential rejection points.
With that information, I’d say to a new trader’s question, “What Now?” That even though the current bias is to the upside, there is a potential pullback to retest 24.09 or even 23.05 so a hold below 26.13 I’d watch for an attempt to first fill the gap then test these levels, so if stalking a long position and cannot get above 26.13, I would have to either be patient to enter a long position after a pullback or be willing to risk price falling as low as 21.82, that decision is based on account size, risk tolerance and certainly emotional tolerance. If price is able to hold above 26.13, that’s an aggressive long opportunity, a more conservative opportunity occurs with a hold above 26.56 and a definite scaling point or potential exit is at 28.12 or 28.73. A hold above 28.73 increases the probability of upside continuation and the risk would then be back inside the PRZ.
