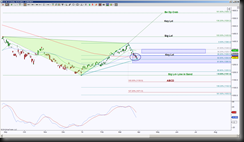
GC_F has pulled back into the middle of a GRZ, harmonically speaking, if this current level being tested as support at 1284.9 is going to be a triangle point, then the required bounce point is 1325.1 but Gold Futures has 1309.3 as the initial resistance test, otherwise known as an obstacle capable of prevention of 1325.1 being tested.
 Looking at a day chart shows either a confluence level of 1309.3 or break down of 1284.9 offers clues as to 1. which GRZ level will be tested first and 2. will that level hold.
Above 1309.3 has a minimum target, for harmonic purposes, at 1325.1, above there has the ideal target at 1585.1 but very important targets along the way at 1388.4, 1430.9 and 1526.2.
Below 1284.9 has the initial support test target at 1260.5, below there has the ideal target of 1181.4 with scaling point at 1205, downside continuation has ABCD targets.
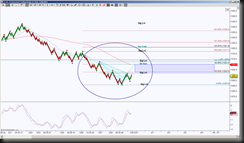
 But first things first, the circle is where I wanted to hone in on an intraday chart, in this case a 16 STRenko bar size. This chart shows there’s an emerging harmonic pattern that has the initial completion target at 1305.2, this will give a running start to test the top of the daily GRZ level 1309.3. A hold above 1305.2, then 1309.3 has the extended target 1321, this helps price get closer to the ideal minimum bounce target on the fay chart at 1325.1.
If price cannot push through 1297.8, it keeps price in a sideways range unless it can break down 1285.9, if so then the day chart targets come into play.
