
Premium premarket video, click here.
Author Archives: Kathy
Premium Members Harmonic Trading Chart for ES_F
Gallery
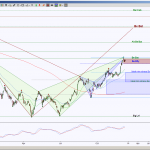
An hour chart offers a nice intraday perspective because it offers levels on a large enough spectrum but not too large to prevent price from reaching them. ES toyed with a Line in the Sand level 1812.50 but currently remains … Continue reading
Premium Members Harmonic Trading Chart for AAPL
Gallery
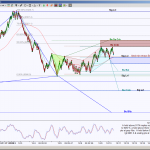
Apple has reached a region where two Harmonic Patterns have a similar completion target, this is called a double PRZ (PRZ aka Potential Reversal Zone), and becomes doubly important whether this zone can hold price or not. A hold below … Continue reading
Premarket and End of Day Harmonic Trading Charts 12/11/13
Gallery
This gallery contains 32 photos.
The left chart is current day’s premarket chart with analysis notes, the end of day charts are the preliminary harmonic analysis for globex and following day’s premarket setups
Premium Harmonic Trading Charts & Premarket Video for 12/11/2013
Gallery
Premium premarket video, click here.
LIVE Real Traders Webinar Year-End Event
Gallery
This Saturday, You’re Invited To Join Us For A Special LIVE Event Where I’ll Be Presenting… Along With A Whole Line-Up Of Other Trading Experts… …Held By “Real Traders Webinar.” Click Here To Claim Your Seat Right Now For The … Continue reading
Premarket and End of Day Harmonic Trading Charts 12/10/13
Gallery
This gallery contains 26 photos.
The left chart is current day’s premarket chart with analysis notes, the end of day charts are the preliminary harmonic analysis for globex and following day’s premarket setups
Premium Harmonic Trading Charts & Premarket Video for 12/10/2013
Gallery
Premium premarket video, click here.
Premarket and End of Day Harmonic Trading Charts 12/9/13
Gallery
This gallery contains 24 photos.
The left chart is current day’s premarket chart with analysis notes, the end of day charts are the preliminary harmonic analysis for globex and following day’s premarket setups
Premium Members Harmonic Trading Charts for 6J_F
Gallery
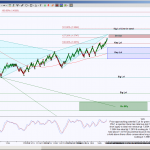
Japanese Yen futures approaching a line in the sand level for opposing emerging Harmonic Patterns at 0.009650 There was a recent break down of a triangular contraction formation and the bias has been to the downside since however it’s a … Continue reading