This gallery contains 32 photos.
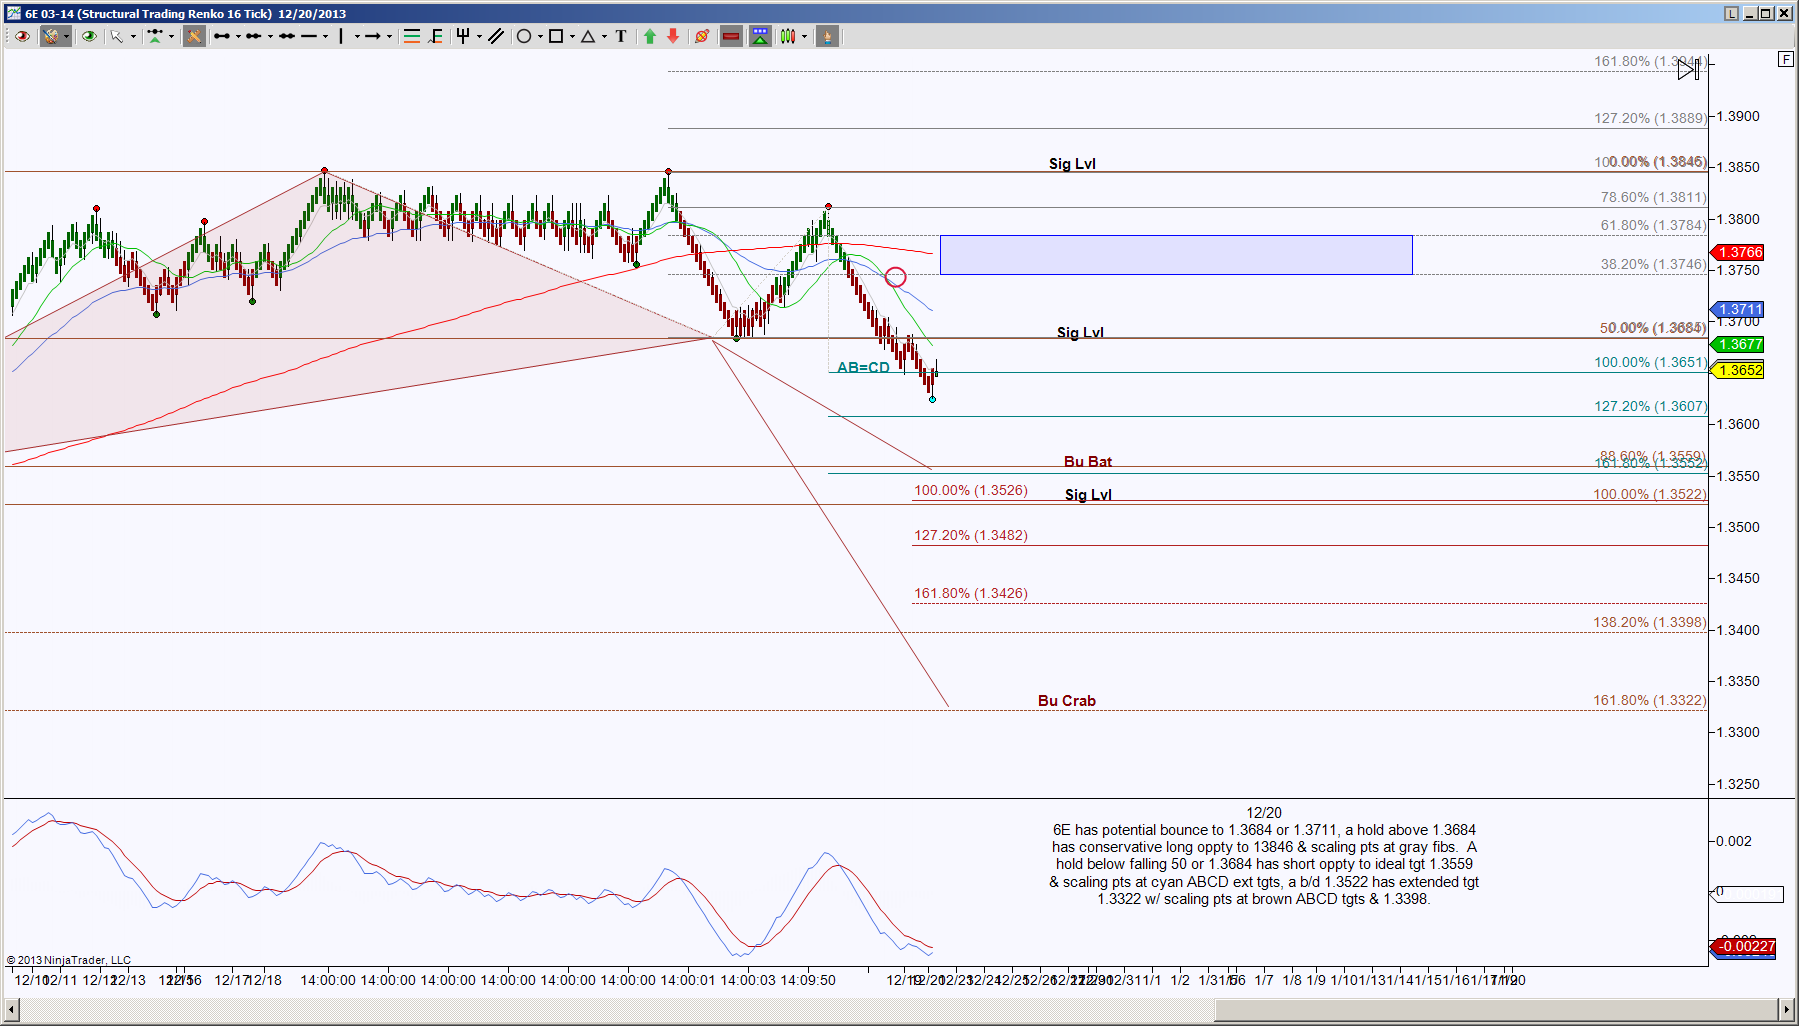
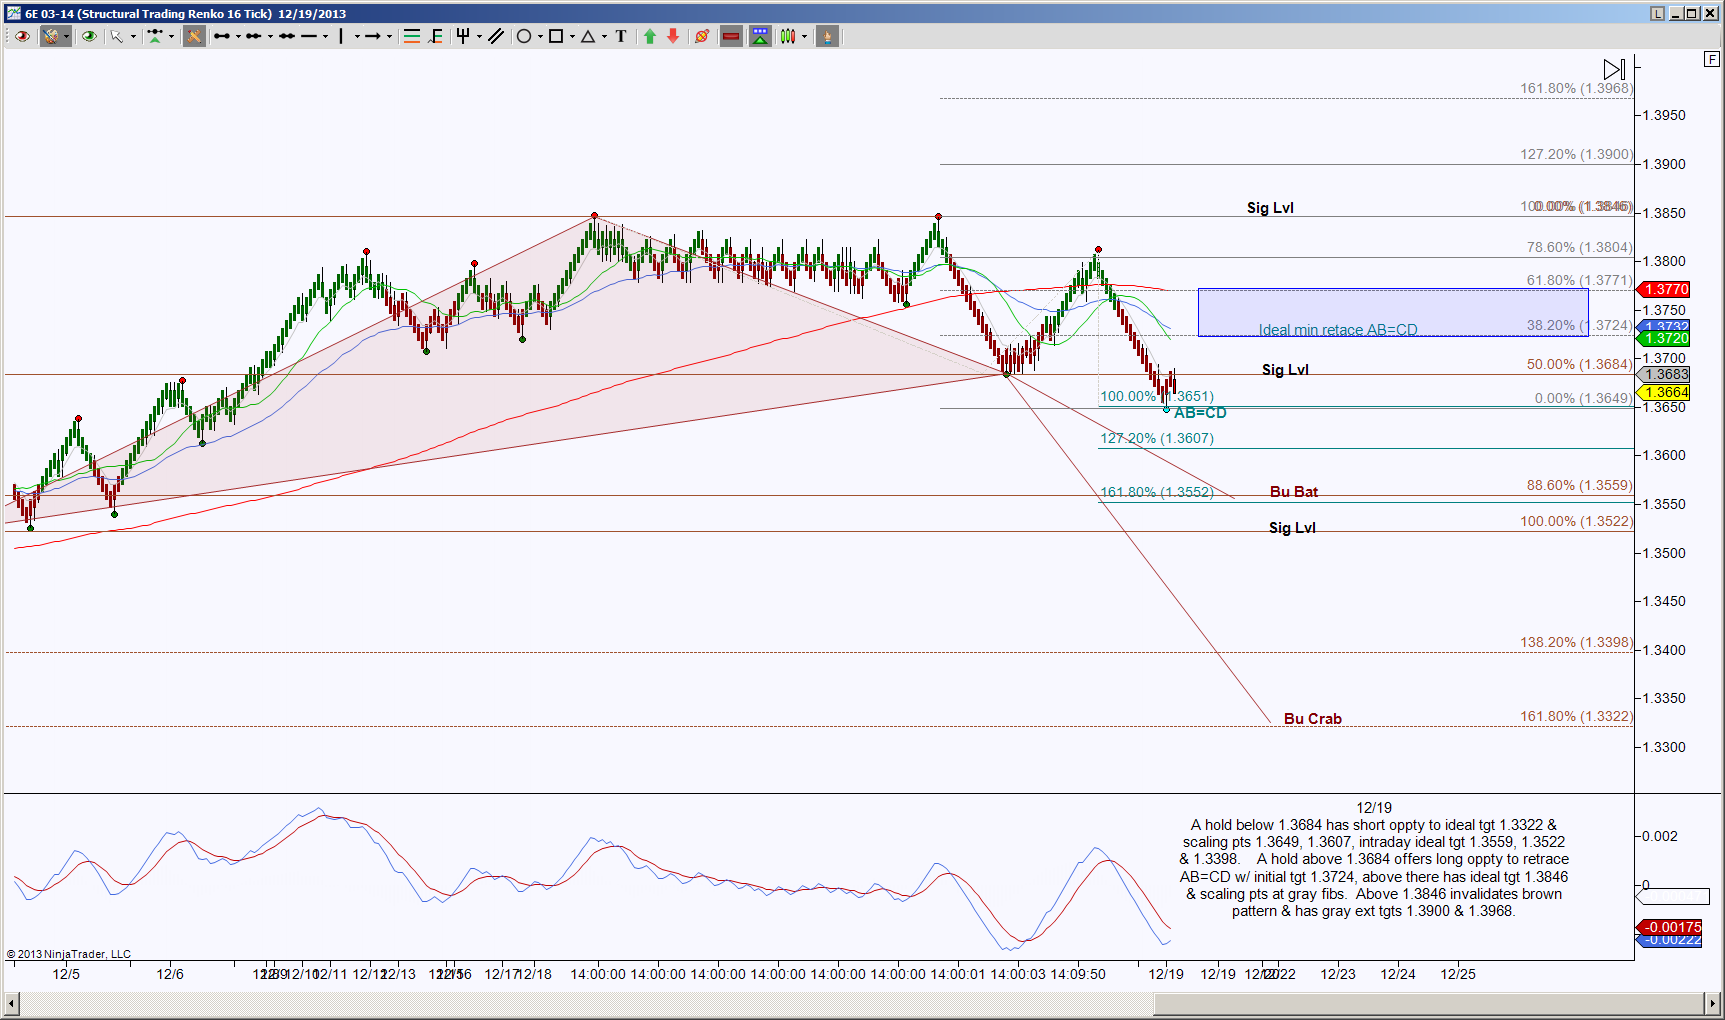
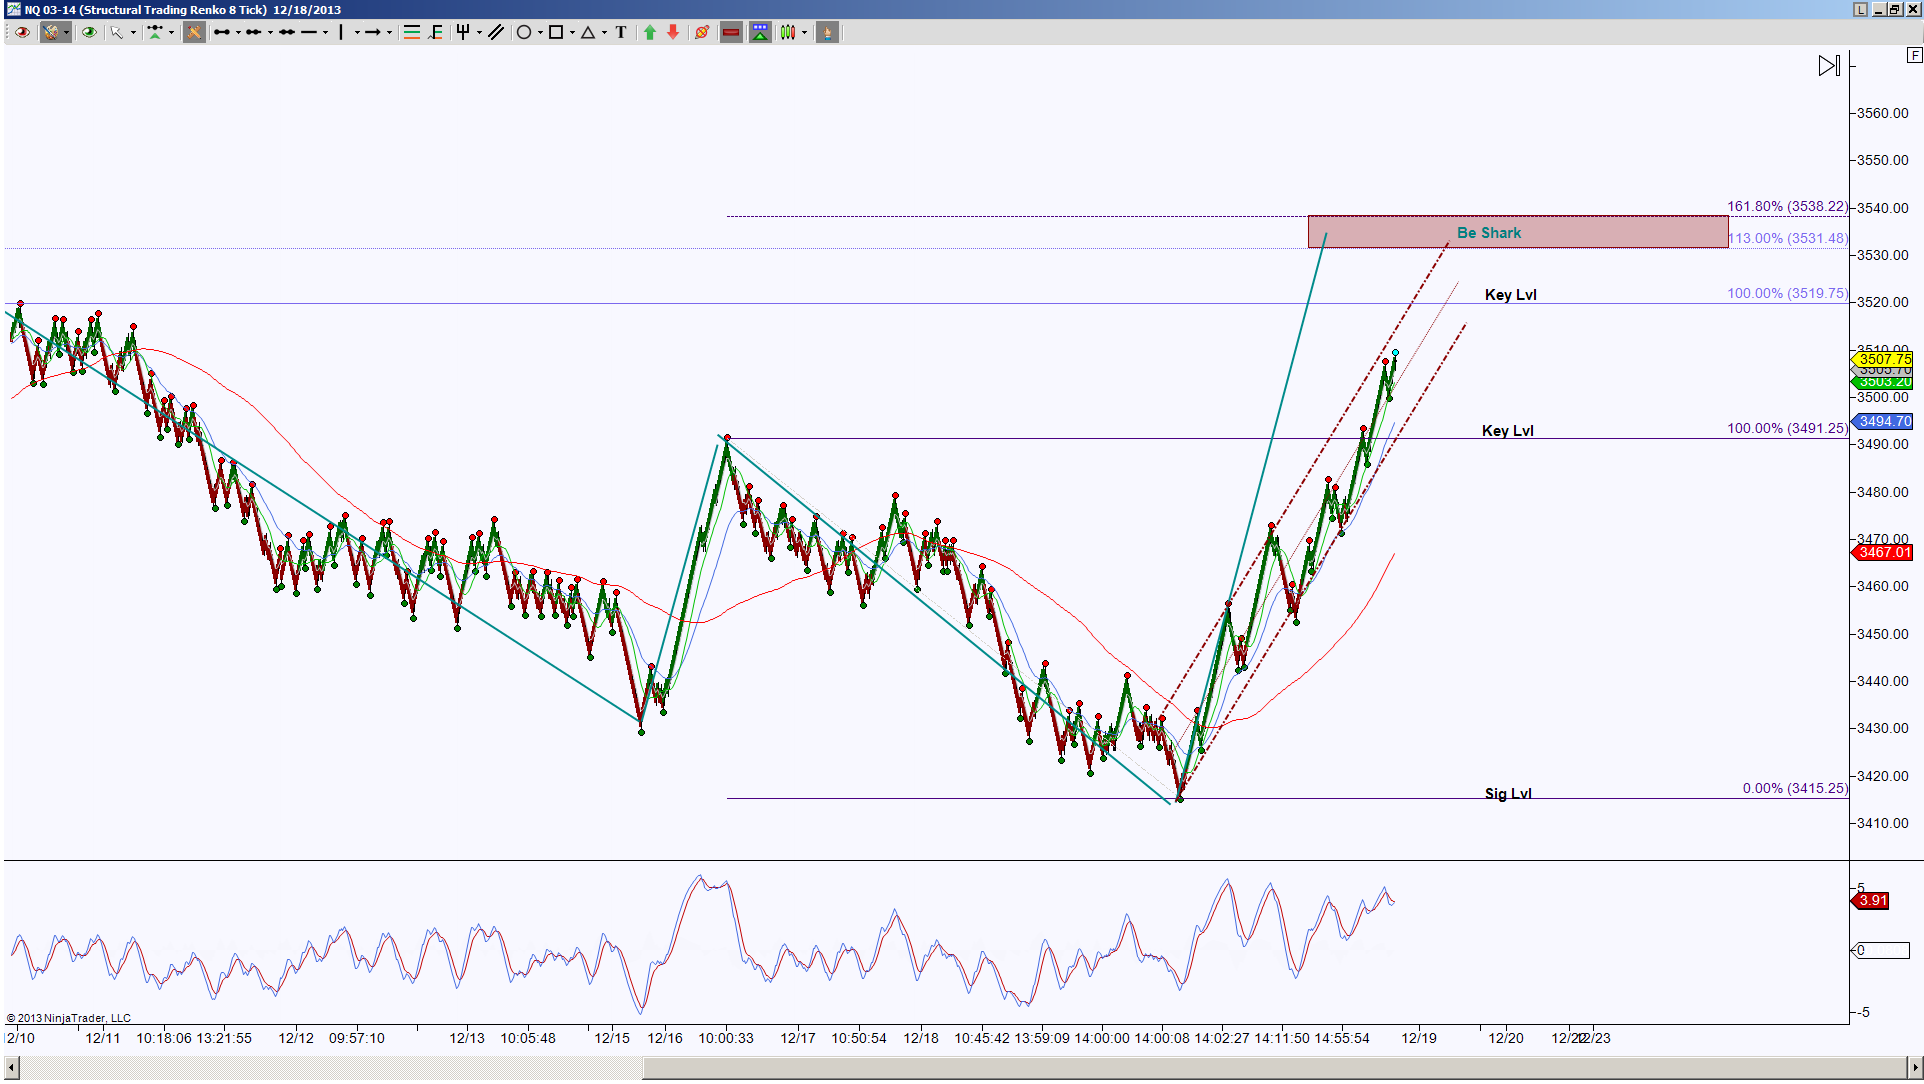
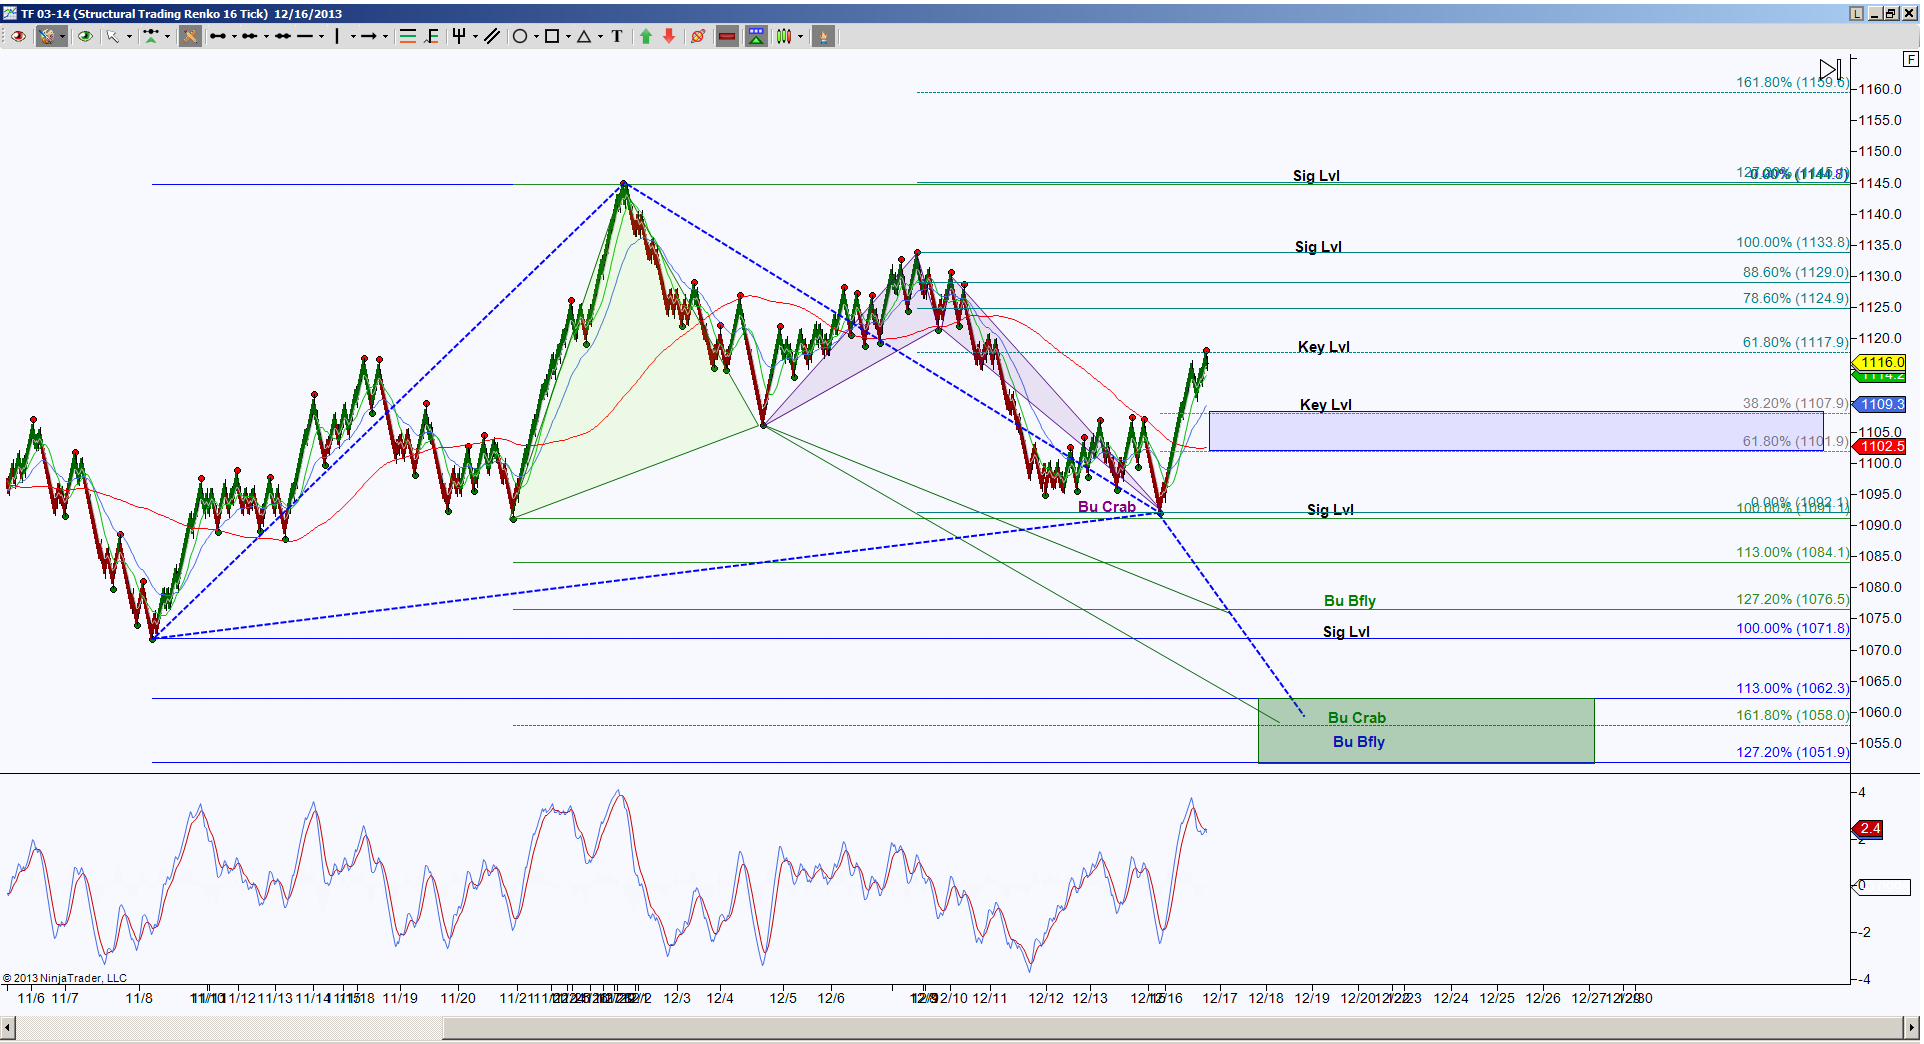
The left chart is current day’s premarket chart with analysis notes, the end of day charts are the preliminary harmonic analysis for globex and following day’s premarket setups

This gallery contains 32 photos.
The left chart is current day’s premarket chart with analysis notes, the end of day charts are the preliminary harmonic analysis for globex and following day’s premarket setups
This gallery contains 30 photos.
The left chart is current day’s premarket chart with analysis notes, the end of day charts are the preliminary harmonic analysis for globex and following day’s premarket setups
Premium premarket video, click here.
Premium premarket video, click here.
Dow Jones E-mini Futures has been in an uptrend and at an interesting point of interest while in decision mode of what will play out. There are harmonic and symmetrical movements that have a downside pull to 15170. The previous … Continue reading
This gallery contains 28 photos.
The left chart is current day’s premarket chart with analysis notes, the end of day charts are the preliminary harmonic analysis for globex and following day’s premarket setups
This gallery contains 28 photos.
The left chart is current day’s premarket chart with analysis notes, the end of day charts are the preliminary harmonic analysis for globex and following day’s premarket setups
Premium premarket video, click here.
Premium premarket video, click here.