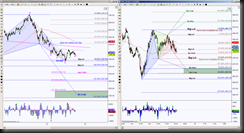
Smaller timeframe, an Hour chart in this scenario, has an emerging pattern that can help the Daily chart’s scenario play out.
- The Day chart shows a Bullish Bat pattern completed and has an ideal minimum retracement target at 507.33
- The Hour chart has an emerging pattern, a Bearish Crab, which completion target of 494.70 helps price push above the two Daily Head & Shoulder necklines and approach the 507.33 target
- The Day chart also has a forming 2nd righ shoulder for Inverse Head & Shoulder formation
- The Hour chart has a Bullish Gartley completion target 427.07, this correlates with an ideal 2nd right shoulder target on Day chart
- The Day chart has a retest of 385.1 target if price cannot push above the necklines
- The Hour chart has a double bullish PRZ (Potential Reversal Zone aka completion target) at 402.72 to 394.70, these pattern completions will help price approach the retest on the Day chart
Overview – Day chart is in contraction mode, it is visible on opposing emerging patterns on the Hour chart, the large Significant levels noted at 465.75 or 418.90 will be the initial important levels for playing out the opposing scenario’s. Because if price breaks out above 465.75, it invalidates the Bullish Gartley and Bullish Crab on the Hour chart and focuses on the upside targets … and if price breaks down below 418.90, it invalidates the Bearish Crab and focuses on the downside targets.

