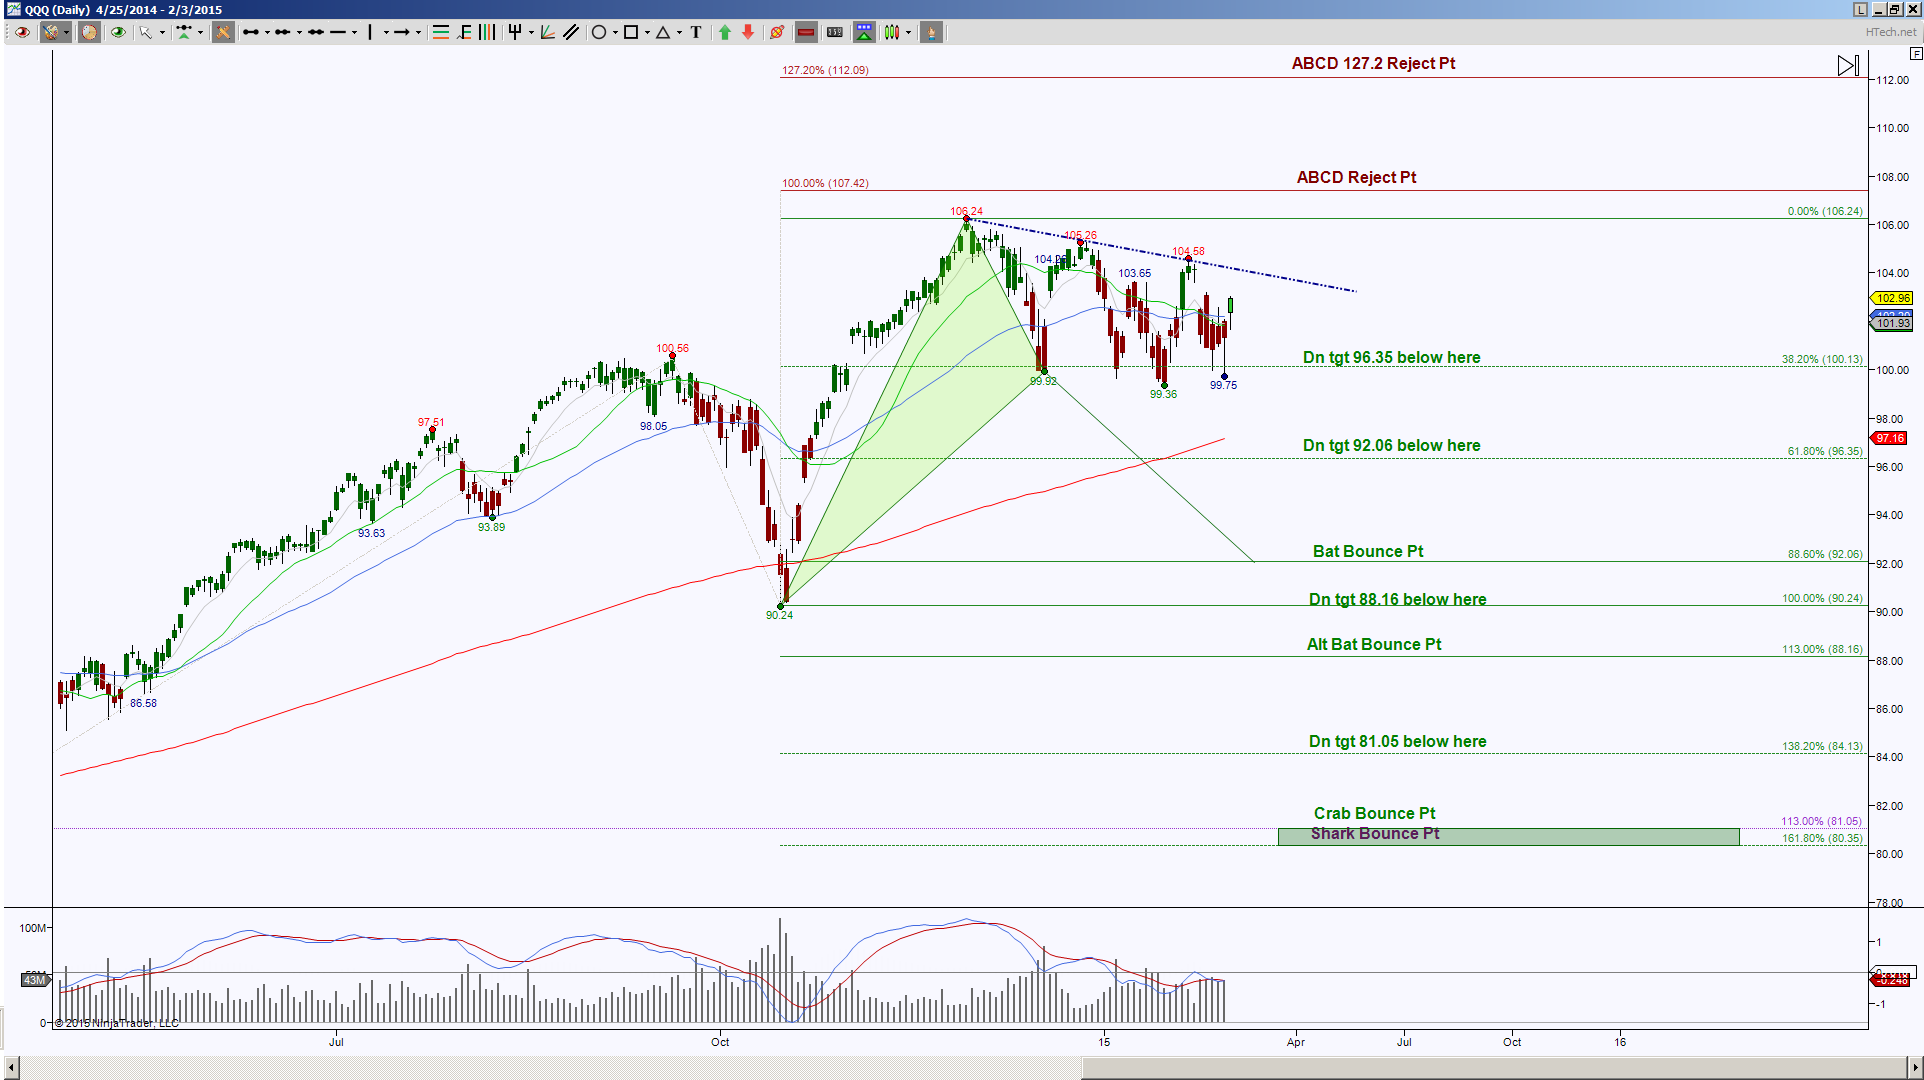
The bigger perspective Day chart shows QQQ is in a range between 106.24 and 99.36. Note also that price has been making lower highers but similar lows, this contracts in a descending triangular or wedge type formation. The blue line represents the trend line that will be a key resistance test and also portrays caution with mere breaches above it. If price is able to close and hold above the blue trendline, the initial upside target is the double top at 106.24. This level is important in the world of harmonics because above it will wipe out the emerging green colored pattern, and a hold above it has upper ABCD targets which also represent rejection points.
Being prepared for any scenario, since there are no guarantees that a level will hold as support or resistance, will help a trader have confidence in a plan versus the mentality of bewilderment and deer in headlights syndrome. When price is in a consolidation or range then the break can be in either direction, that’s not saying there aren’t times when the probability favors one direction over the other, it’s just saying there’s no harm in being prepared. With that said, a close and hold below 100.13 and more important below 99.36, the the probability increases to complete the green colored pattern, in this case a Bat, at the target of 92.06 but first there is an important level of 96.35 that will need to be dealt with.
How much if any bounce occurs upon the test of 92.06 offers clues as to which targets are higher probabilities. Downside continuation from 92.06 has the ideal target at a double PRZ (Potential Reversal Zone aka the completion zone of a harmonic pattern), since this is a “double”, there are two different harmonic patterns that converge into one target. This creates a magnetism for testing that region as well as a strong support and or bounce point.
Now let’s look at an intraday perspective for any correlation to the Day chart levels.
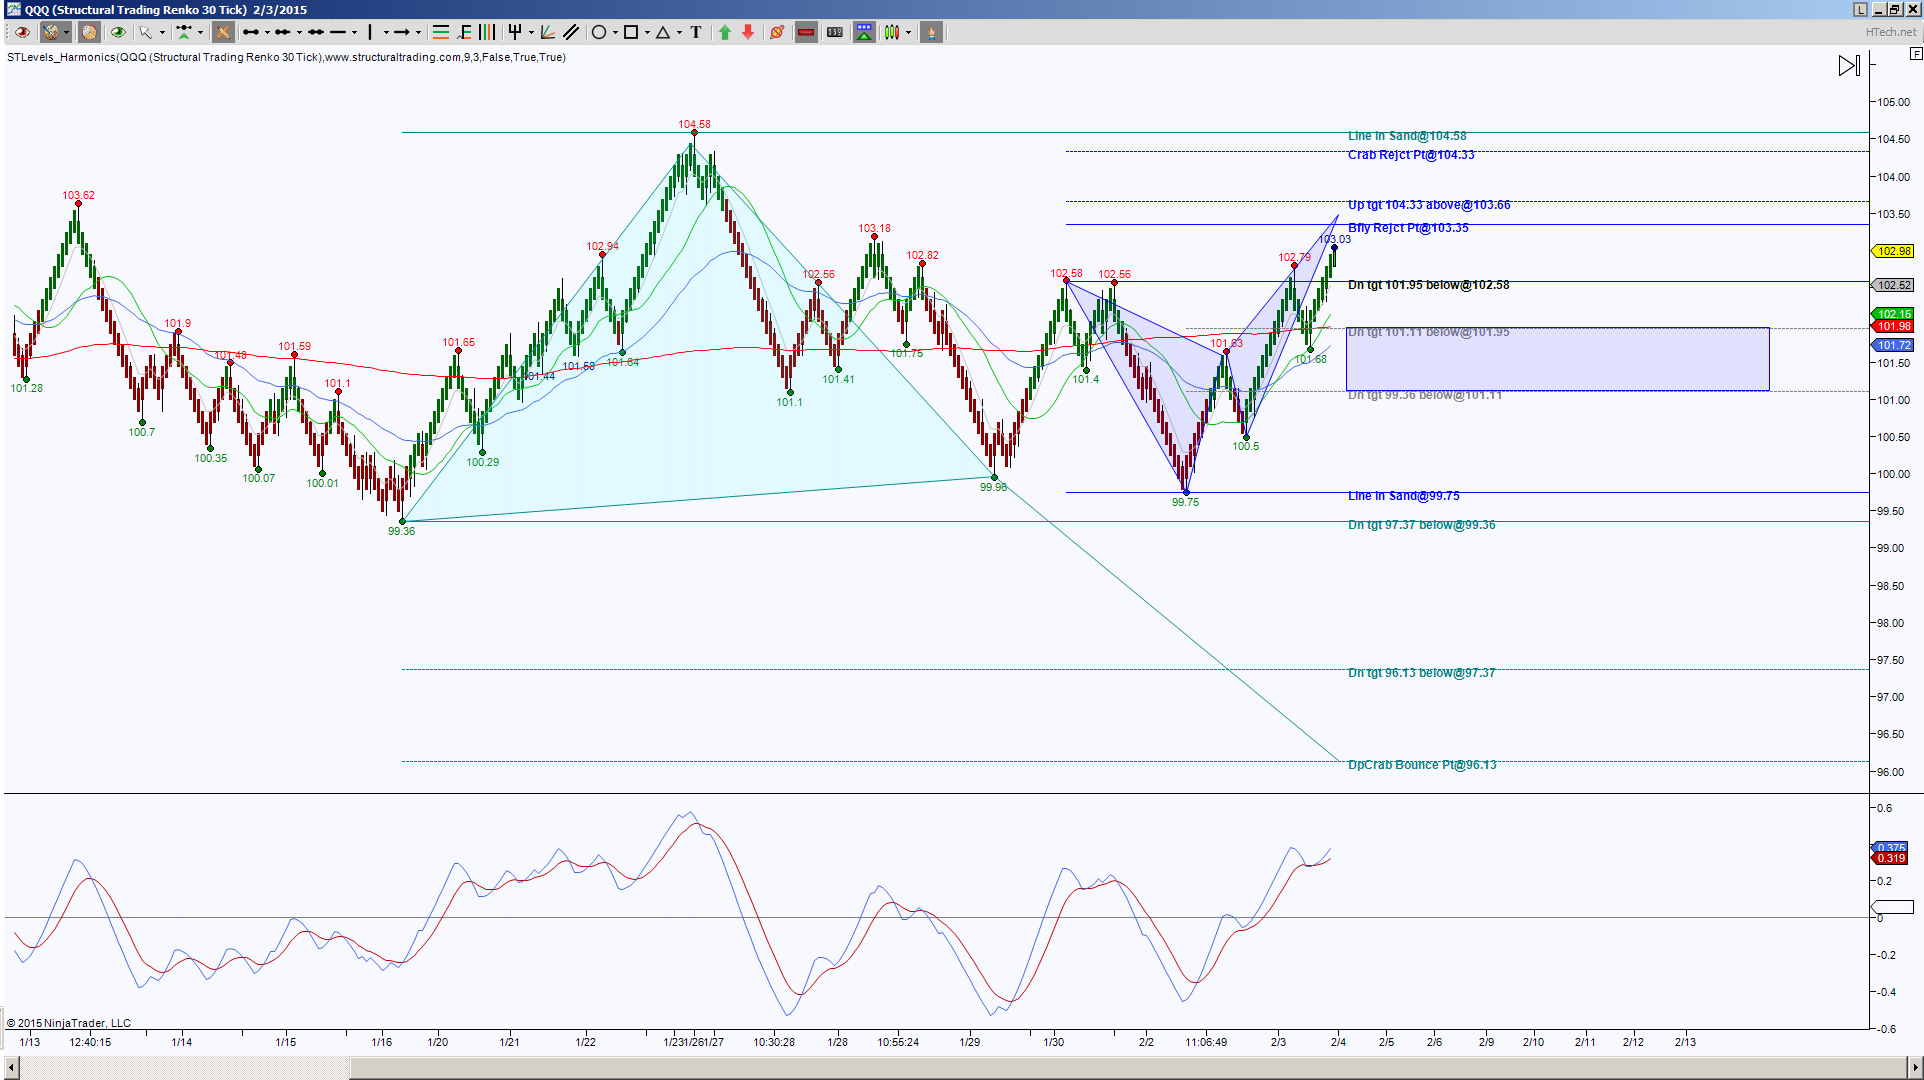
I’m using an STRenko 20 bar chart, this shows there are opposing emerging patterns which is typical of price in a range or form of consolidation. The intraday bias is to the upside, it’s approaching a probable rejection point at 103.35, although price could breach this level to test 103.66, the key is whether price continues higher or falls back under 103.35.
A valid rejection has a pull back target of 102.58, below there risks the intraday bias to shift to the downside, especially if price falls below 101.95 and if this is the case, each level noted on the chart that gets taken out (price holds below it) the higher the probability of completing the large emerging cyan pattern called a Deep Crab at 96.13.
Note that once price is below 101.95, the next downside target is 101.11, this test will help the Day chart range support be tested. The completion of the intraday Deep Crab at 96.13 will help price breach below the daily 200 moving average which will be important to keep your eye on.
On the upside of the intraday chart, above 103.66 has the target of 104.33 to complete an extended harmonic pattern, a Crab. This has breach potential to test the double top which correlates with the Day resistance trendline and above there we have those upside targets as labeled by ABCD’s.
So what’s it going to take to break out of the QQQ range? I just gave the long version, here’s the short one: Above 104.58 then more important above 106.24 or a completion of patterns to the downside at 96.13, 92.06, 88.16 or 81. I reckon just to have said that would make for a short article but get to the point, but for those that prefer to find a purpose of levels, the long version is for you.
Trading involves substantial risk and is not suitable for all investors. Past performance is not indicative of future results.


