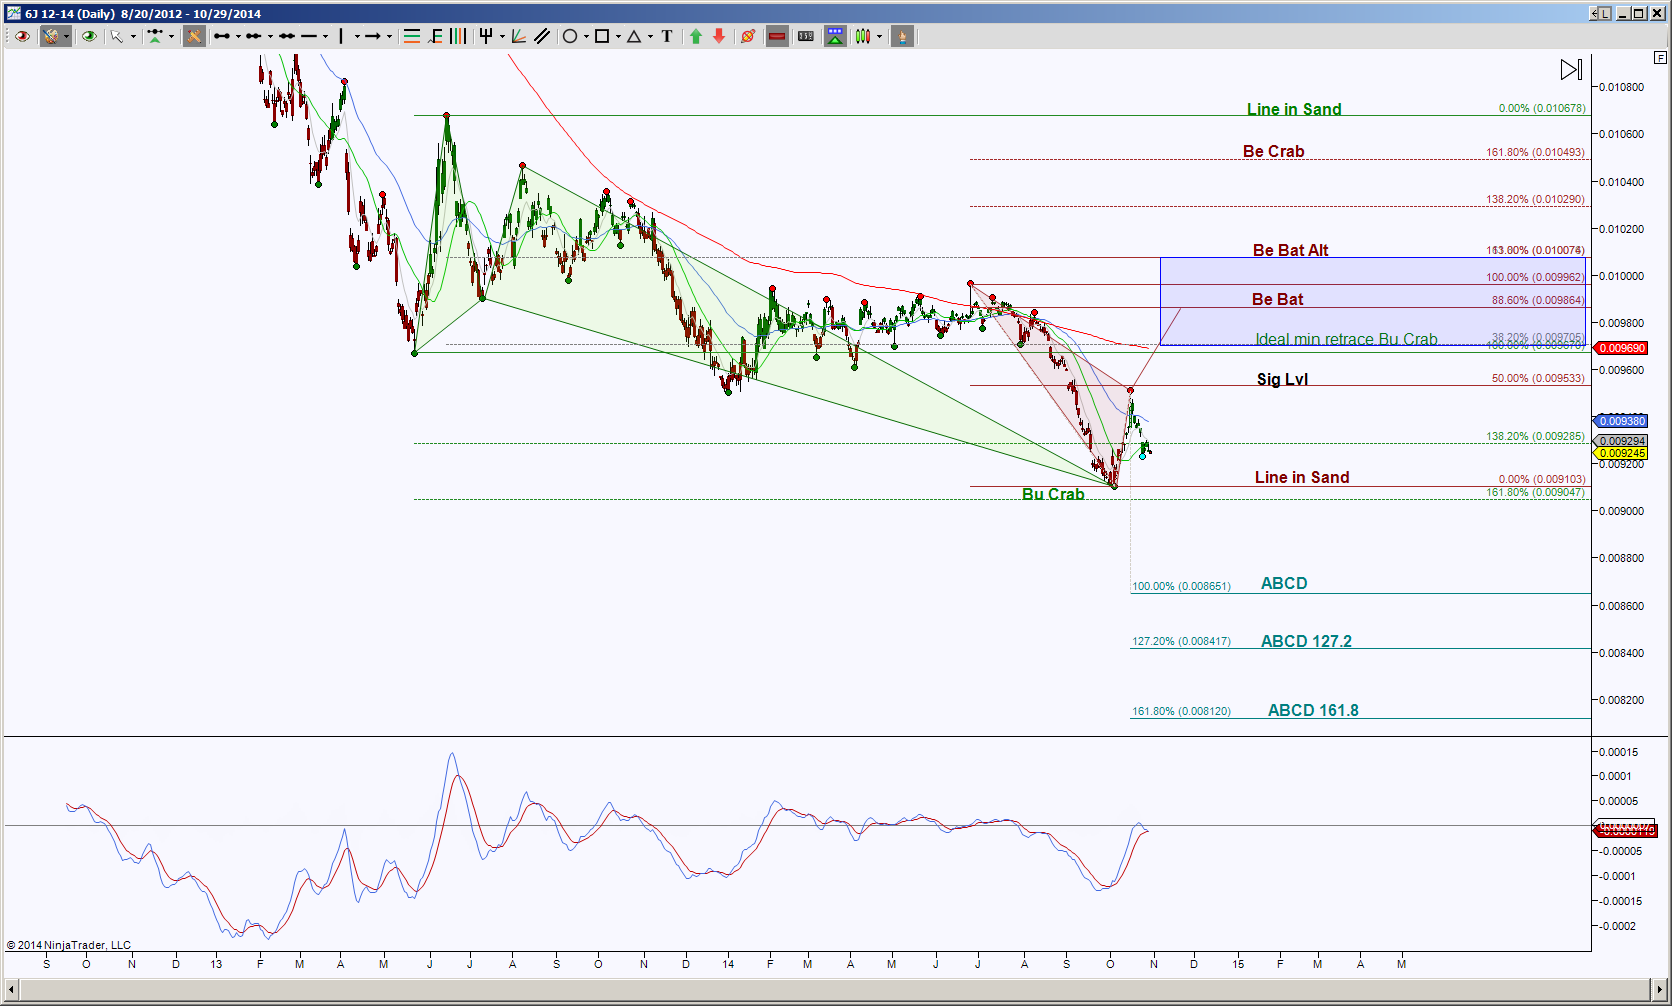
Japanese Yen has completed a day timeframe bullish harmonic pattern, the ideal minimum retracement target is .009705 and failure to get there is a strong implication of continued downside bias. A hold below .009285 has the retest target of .009103 and a potential breach to test .009047, failure to find some buyers that can have a respectable retracement and especially if price holds below .009047, the probability of testing the ABCD targets increases.
 The day chart also shows that there is a smaller emerging pattern, colored brown. If this pattern can complete it will help price retrace the larger green colored pattern 50%, 61.8% and approximately 88.6% depending on which PRZ (Potential Reversal Zone aka a harmonic pattern’s completion zone, can be reached.
So the .009103 is the line in the sand level and offers a very important support test, harmonically speaking.
 For an intraday perspective, I’ve chosen an STRenko 16 Bar. This perspective shows that price is stalling at a bullish PRZ between .009266 and .009221. This zone offers important levels for price to hold beyond, if can hold above .009266, the probability increases of going into retracement mode where the ideal minimum target is .009339 and the ideal target is .009510 and scaling points at the gray fibs.
If price holds below the PRZ or .009221, the probability increases of testing the double PRZ between .009116 and .009082 and scaling point at .009168.
The intraday view currently has a downside bias, I wouldn’t consider a potential shift of that bias until first price can hold above .009302 and second a hold above .009339.
Note that should price reach the double PRZ (midpoint at .009100) helps price test the daily chart’s Line in Sand level .009103. And that if price can hold above .009339 helps the daily price hold above it’s GRZ (Golden Ratio Zone) level of 9285.
