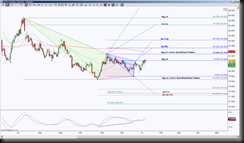
US Dollar Index has multiple harmonic patterns emerging, this is typical of indecision, consolidation or stalling. Momentum is attempting to pull price up and the more significant levels price can old above, the higher the probability to play out the harmonic patterns that have an upside completion target.
 This daily chart looks pretty with the opposing emerging patterns, color-coordinated for ease of connection. The blue triangle goes with the blue text pointing out the completion target of that particular pattern at the blue Fibonacci’s, same with the green and the brown. But within the pretty colors and triangles, there is symmetrical and geometric reasoning.
Price is currently testing a noted significant level at 81.059, this is the current line in the sand because if price holds above it, the probability of completing the blue pattern increases, a hold below the 81.059 level increases the probability of testing 79.500.
Trading harmonic patterns requires patience, to allow price to come to the important target, thus offering less risk entries. So looking at the pretty triangles, there’s a story revealed stating the blue pattern’s purpose is to help price hold above the 81.705 Line in the Sand level, once this occurs the probability of completing the green pattern increases, and the purpose of the brown pattern is to push price to lower targets and invalidate the blue and green pattern by holding below 79.185.
Watching price behavior at the noted levels offer great trading opportunities, if a trader can be patient, mechanical and conscientious of risk management. Initially, a hold above 81.059 offers a long opportunity to the ideal target of 83.068 (notice this correlates with a previous swing high from September) and scaling points at 81.705 and 82.305. A hold above 83.068 has the ideal target at the double top 85.260 and scaling point at 84.567.
Scaling points are also potential reversal points so these are regions to tighten a position, take profits, protect profits or stalk a reversal position. A hold below 81.059 offers a short opportunity to retest 79.500, below there invalidates the blue pattern and has a short target of 79.185, this is a very important level because the largest of these patterns is the green one, and a break down of 79.185 invalidates the largest pattern, having ideal downside target at the double PRZ (Potential Reversal Zone aka a harmonic pattern’s completion target) at 77.815 to 77.628 and a scaling point at 78.222.
