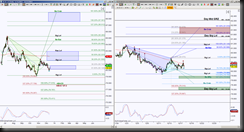
US Dollar hour chart shows price is stalling between opposing emerging Harmonic Patterns while staying in a daily downtrend channel as described in a previous post .
 This is a great example of how smaller timeframes create harmonic rotations to help larger timeframe Harmonic Patterns play out. The chart shows the day chart on the left and the hour chart on the right. The bigger picture is price is still inside a downtrend channel forming the fourth out of five legs for a green Bearish Bat Harmonic Pattern, the max target for this leg is 79.185. Also price is stalling inside a GRZ (Golden Ratio Zone) which I like to use as initial directional bias.
There is heavy confluence on the daily level 80.742 region, there is a small emerging blue pattern on the hour chart, a completion of this pattern will help price push above that daily 80.742 level, thus implying that the leg is complete and the final leg is forming.
So shift to the hour chart, first note that nearby day levels of importance are labeled in larger font. Now let’s focus on the opposing emerging Harmonic Patterns, the line in the sand for this opposition is either 79.880 or 80.570 meaning a break of one of these levels will invalidate one of the patterns.
A hold above 80.082 has a long opportunity to the ideal target of 81.919 and scaling points at 80.570, 80.996, 81.140 and 81.506 (day level).
Be aware that what I consider scaling points are also potential rejection points so honor these levels as a possible delay or prevention of price hitting higher targets. Note that the Be Bat (Bearish Bat) PRZ (Potential Reversal Zone aka a Harmonic Pattern’s completion target) has a potential of being a rejection point, so a strong reversal pattern will go into retracement mode with downside bias, this whole scenario of completing the hourly Bat and going into retracement mode would be a daily breach of the channel resistance line and GRZ level 80.742, and the retracement of the hourly bearish Bat will help price return to that daily breakout region to test for support.
Take it a step further and failure to hold above 80.742 suggests that hourly Bearish Bat wants more retracement, that the daily fourth leg is still forming (remember it can go to 79.185 and remain a valid leg), and it could also be a retest of that daily channel support line.
Sound complicated? It’s really not, but can appear so if you’re not used to seeing how smaller timeframe price action intertwines with larger timeframe scenarios.
Here’s another thing that I find extreme value, always be prepared for the opposite scenario, this offers a risk parameter of where I’m wrong in my initial bias and offers a fluent mind acceptance of seeing what is rather than what I think it should be.
So, with that said, a hold below the hourly level 80.082 offers a short opportunity to the ideal target 79.185 daily level. There is a cyan Butterfly and Crab Harmonic Pattern that can help price get closer to that daily level. The scaling points along the way are 79.880 (remember this is a line in the sand for the blue pattern and below 79.880 invalidates the blue pattern), 79.692 and 79.454.
A completion of the cyan Bu Crab (Bullish Crab) and a valid reversal pattern would go into retracement mode, thus keeping the daily green pattern in play because it remains a valid emerging Harmonic Pattern as long as 79.185 is not breached.
Opposing emerging Harmonic Patterns are a clear cut sign of indecision or stalling action. The ultra conservative entries are a close and hold beyond the line in the sand levels.
