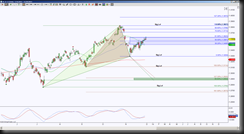
Harmonic patterns typically have a triangle as an important component. The three points of the triangle offer targets, invalidation levels and risk management levels.
 The 6EZ13 chart shows two triangles, a green and brown one. Based on the guidelines of Harmonic Patterns, the third point of the triangle determines the completion of the pattern, and in this case both of these patterns have a completion target very close to one another that is called a PRZ (Potential Reversal Zone) When two different patterns create a common area zone, it becomes a more important level if price gets there.
Harmonic patterns have five specific points, currently both of these Harmonic Patterns are forming the fourth point, the maximum target for this point is 1.3827, and it’s not until the fourth point is complete does the final leg to to create the fifth point occur.
When price is above the third point of a triangle, the ideal target is the highest point of the triangle which is 1.3827. Remember this is also the maximum target for the fourth point for the two Harmonic Patterns on this chart. The blue fibs (short for Fibonacci) are potential targets for that fourth point, up to 1.3827. When price is below the third point of the triangle, the ideal target is the lowest point of the triangle.
A good rule of thumb in regards to a GRZ, Golden Ratio Zone (comprises of the Fibonacci levels between 38.2% and 61.8%) is that once price is inside the GRZ, it has a probability of reaching the other side especially when the half way mark (aka 50%) fails to hold. The GRZ also offers additional bias for direction because if price holds above it, it increases the probability of reaching the high point of the triangle, and if it holds below it, it increases the probability of reaching the low point of the triangle.
So, taking all this into consideration, the chart tells this story: Price is testing an important resistance level at 1.3623, a hold below there implies the fourth point of the Harmonic Patterns is complete and has the ideal downside target of 1.2920 and scaling points at the bottom of the GRZ, the midpoint of the triangles, and the low point of the brown triangle.
To continue with the story for the opposite scenario (it’s a good idea to be prepared for all directions): A hold above the GRZ implies the fourth point of the Harmonic Patterns is still forming and continues with the upside bias with the ideal max target at 1.3827 and scaling points at the blue fibs between the GRZ and the high points of the triangles. If price exceeds the 1.3827 level it invalidates the emerging Harmonic Patterns.
And finally, the scenario of sideways action: As long as price holds inside the GRZ implies sideways price action and offers smaller targets until it breaks and holds one side or the other of the GRZ.
And for me, I label the points of the triangle as Sig Lvl (Significant Level), this way, even if I go to a smaller timeframe where the triangles are out of the chart’s range, I know the level that says “Sig Lvl” is a point in a triangle.
