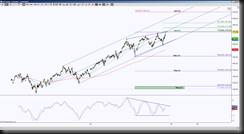
Can SPY die? There is heavy confluence merging at the 175 region, a wedge resistance line, Pitchfork midline, a 113% extension and AB=CD target. So when there are 4 different means of finding one level … it creates a wall of resistance which offers a probability of rejection. Since the markets offer no guarantees, probabilities offer the best edge. However, when price comes to a wall of resistance (or support), and price does not reject that level, it makes a huge statement. Keep in mind, it’s one thing for price to breach the wall (to peek to the other side per say), it’s another thing to hold beyond it.
There are several clues suggesting at the least, that a pullback is in order, one, a wedge formation at the top of a run, this is often an indication of losing ground. Another clue is momentum is totally contracting into the opposite direction, and also one of the best visual indications of a stall or pullback time is when faster moving averages (like for instance 20 and / or 50) are very far from price.
Currently the only Harmonic Patterns setting up are ABCD’s, this is what occurs when higher highs keep forming in upside impulsive moves. However, there is a potential Shark or 5-0 attempting to form, but until a rejection of the resistance occurs, price may not be finished with this move to test levels here.
What to do with this information? There’s a potential breach of 174.51 to test the ideal ABCD target 175.98. This is not the area to be initiating a long position, conservatively speaking, a better setup is a close above 175.98 followed by a resistance test to eliminate a fake breakout. Yeah … this is where patience comes in. If you’re already in a long position, due to the confluence and clues, don’t allow a winning position turn into a losing one, so this is a good time to take some profits or protect some profits.
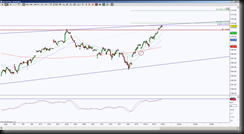
As far as a counter-trend trade setup, a hold below 175.98 or 174.51 offers a short opportunity. The other option is to go to a smaller timeframe and seek a setup from there. Here’s an hourly chart:
Note there was a previous high at 173.52, a conservative approach for a short opportunity is wait for a close below and followed resistance test of that level. Yep … again patience is a requisite. The reason the conservative approach is suggested, especially if you’re new to trading or seeking a strategy, is because price could just be stalling between 174.51 and 173.52 until those hourly moving averages get closer to price. After all, there was a bullish cross and so far the retest of those moving averages have validated the cross.


