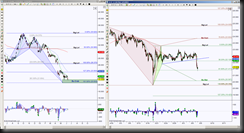
SI_F currently at second test of Bullish Crab PRZ (Potential Reversal Zone)
- Only the top of the zone has been tested, a hold below 21.604 implies all levels in the zone test attempt
- It’s one thing to breach below 20.654, it’s more important if consequently holds as support, if so, retracement ratios become the upside targets with emphasis at 26.370
Intraday chart (hourly) is in sideways range between 24.835 and 20.250
- Currently price broke down smaller range support 22.129 and blue trendline to test 21.411 fib
- Potential bounce into the break down point for resistance test
- A break down 21.411 has tgt 20.597 to complete a Bullish Bat, form an important leg in larger emerging Bearish Gartley, and help test all levels of the Daily zone
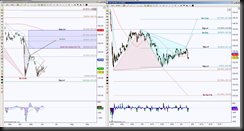
GLD broke down Daily channel (red) in attempt to test the Bullish Crab PRZ for the third time
- A valid break down of the channel (meaning does not bounce back inside it) has 130.51 target, typically a third test has probability of breaking through it … remember a probability is just that … a probability, not a certainty
- Another clue of bearish bias is neither test of the Bullish Crab has had success in reaching even the minimum ideal target of 38.2% retracement, thus shallow attempt to reverse, suggesting the bears have upper hand in relation to the bullish pattern
- Another scenario is price could just be testing the support of a sideways range
Intraday chart (hourly) is in between opposing emerging patterns, indicative of sideways consolidation
- A hold below 134.72 has important support test at 130.35, this is a determining factor in the opposing patterns, because if it breaches it, it invalidates the cyan emerging Bat
- A hold above 130.35 keeps price in sideways range and suggests attempt to test the upper portion of the range at 137.12 initially, then 143.88.
- A hold above 137.12 has 142.34 target, potential breach to test the 143.88, but a break through 143.88 has 147.56 target and will help the Daily retracement reach the ideal minimum target at 147.15


