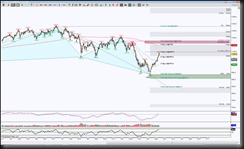
**The new STRenko & STRange indicators have been completed, I’ll be sending out after I test it, so sometime by end of this weekend. Thank you for your patience.” ** I am out of town, the hotel did not … Continue reading
Monthly Archives: March 2016
Premium Harmonic Intraday Trading Charts for 03/10/2016
Gallery
Here’s intraday charts for contract rollover to June for ES, NQ & TF **There has been an issue with STRenko and STRange bars in NT, we hope to be sending out new indicators soon, there’s still some minor obstacles but … Continue reading
Premium Harmonic Intraday Trading Charts for 03/09/2016
Gallery
**There has been an issue with STRenko and STRange bars in NT, we hope to be sending out new indicators soon, there’s still some minor obstacles but we’re almost there. ** The stock charts posted so far this wk have … Continue reading
Premium Harmonic Intraday Trading Charts for 03/08/2016
Gallery
**There has been an issue with STRenko and STRange bars in NT, we hope to be sending out new indicators soon, there’s still some minor obstacles. ** The stock charts posted so far this wk have same harmonic scenario if … Continue reading
Premium Preview: Is Small Caps Capped To Upside?
TFH16, the emini futures for Russell 2000, has been moving to the upside in a Retrace Mode compliments of a Bullish Butterfly harmonic pattern. How much a harmonic pattern retraces is key, and shallow retracements represent a cap to that movement.
The Day chart shows the Butterfly completed at 936.2, this is actually the initial test of the PRZ (Potential Reversal Zone based off a harmonic pattern’s completion zone), upon completion retracement targets are immediately known, in this case, the initial retracement target to the upside is 1068.4 and the ideal target is 1282.2
Currently price has breached the minimum target, this places price inside what I call a GRZ (Golden Ratio Zone based off Fibonacci ratio’s area between 38.2% and 61.8%. So now where price breaks and holds outside the GRZ is important and offers a clue to directional bias and which targets have a higher probability of being tested.
Trading involves substantial risk and is not suitable for all investors. Past performance is not indicative of future results.
Premium Harmonic Charts for the week of 03/7/2016
Gallery
There are swing charts for some stocks included. Some members only trade futures, others stocks or ETF’s. It’s not meant for an individual to trade all these instruments at once, but rather choose favorites. The best trades are those that … Continue reading
Premium Harmonic Intraday Trading Charts for 03/04/2016
Gallery
**There has been an issue with STRenko and STRange bars in NT, we hope to be sending out new indicators soon, there’s still some minor obstacles. ** The stock charts posted so far this wk have same harmonic scenario if … Continue reading
Premium Harmonic Intraday Trading Charts for 03/03/2016
Gallery
**There has been an issue with STRenko and STRange bars in NT, we hope to be sending out new indicators tomorrow. ** The stock charts posted so far this wk have same harmonic scenario if there’s no updated chart. The … Continue reading
Premium Harmonic Intraday Trading Charts for 03/02/2016
Gallery
**There is an issue with STRenko and STRange bars in NT, it is in the process of being resolved. ** The stock charts posted so far this wk have same harmonic scenario if there’s no updated chart. The Day Swordlines … Continue reading

