
Premium premarket video, click here.
Monthly Archives: February 2014
Can Natural Gas Continue Upside Break of 2-Year Range
Gallery
United States Natural Gas fell from a June 2011 high of 50.56 to an April 2012 low of 14.25, before it started its two year sideways range between 23.80 and 17.28. The end of January 2014, there was finally enough … Continue reading
Premium Harmonic Trading Charts & Premarket Video for 2/4/2013
Gallery
Premium premarket video, click here.
Premarket and End of Day 2/3/14
Gallery
This gallery contains 28 photos.
The left chart is current day’s premarket chart with analysis notes, the end of day charts are the preliminary harmonic analysis for globex and following day’s premarket setups For Left chart premarket video, click here
Premium Harmonic Trading Charts & Premarket Video for 2/3/2013
Gallery
Premium premarket video, click here.
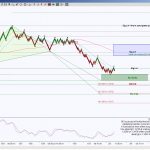
DX_F Testing Potential Rejection Point
Gallery
DX_F is currently testing a potential rejection point due to an intraday Bearish Bat harmonic pattern, how much retracement, or failure to retrace, offers a simple method of probable bias. After all, probabilities are a trader’s edge. There’s no 100% … Continue reading
All Access Harmonic Trading Charts for 2/3/2014
Gallery
Premium Members Harmonic Trading Charts for 2/1/2014
Gallery
**Note ** Use these longer timeframe charts throughout the week, intraday charts will be posted daily. These charts are also setups for swing entries.