
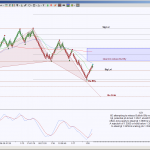
The S&P Emini Futures day chart shows price has been holding inside a range between 1846.50 and 1811.25. Harmonically speaking, this is more often than not, indicative of opposing emerging patterns battling it out. There will always be levels that … Continue reading
Daily Archives: January 21, 2014
Premarket and End of Day Charts 1/21/14
Gallery
This gallery contains 34 photos.
The left chart is current day’s premarket chart with analysis notes, the end of day charts are the preliminary harmonic analysis for globex and following day’s premarket setups For Left chart premarket video, click here
Premium Harmonic Trading Charts & Premarket Video for 1/21/2013
Gallery
Premium premarket video, click here.