This gallery contains 30 photos.
The left chart is current day’s premarket chart with analysis notes, the end of day charts are the preliminary harmonic analysis for globex and following day’s premarket setups

This gallery contains 30 photos.
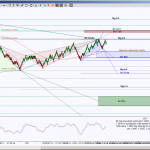
The left chart is current day’s premarket chart with analysis notes, the end of day charts are the preliminary harmonic analysis for globex and following day’s premarket setups
Premium premarket video, click here.
This gallery contains 30 photos.
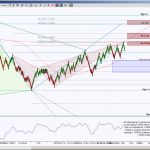
The left chart is current day’s premarket chart with analysis notes, the end of day charts are the preliminary harmonic analysis for globex and following day’s premarket setups
Premium premarket video, click here.
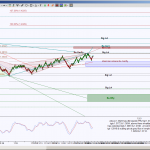
S&P Futures has tested an intraday confluence support at 1785.75. This is the bottom of an uptrend Pitchfork line that correlates with a potential triangle point for an emerging Harmonic Pattern, called Bullish Butterfly. Even though the overall trend is … Continue reading
This gallery contains 30 photos.
The left chart is current day’s premarket chart with analysis notes, the end of day charts are the preliminary harmonic analysis for globex and following day’s premarket setups
Premium premarket video, click here.