This gallery contains 26 photos.
The end of day charts are the preliminary harmonic analysis for globex and following day’s premarket setups

This gallery contains 26 photos.
The end of day charts are the preliminary harmonic analysis for globex and following day’s premarket setups
Premium premarket video, click here.
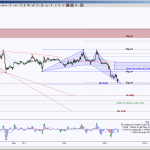
Can oil futures, CLX13, break it’s 3 month range? The Day chart showd price has recently tested 101, the lower region of the sideways range. So what is the probability that price will stay inside the range, I’m not a … Continue reading
This gallery contains 24 photos.
The end of day charts are the preliminary harmonic analysis for globex and following day’s premarket setups
Due to no early internet connection, no video today
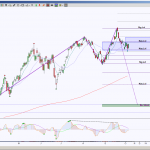
Since SPY is the ETF for the S&P Emini Futures, ES, it makes sense that the two charts correlate. I’ve used RTH (regular trading hours) for SPY … mainly because this instrument typically has globex spikes, that I personally find … Continue reading
This gallery contains 30 photos.
The end of day charts are the preliminary harmonic analysis for globex and following day’s premarket setups


