Skip to primary content
Skip to secondary content

Structural Trading

Building Trading Analysis Through Structure

Structural Trading

Main menu

  • Home
  • Login
  • About
    • A Path To Trading
    • Vision Statement
    • Disclaimer
  • NinjaTrader & Kinetick
  • ST Proprietary Indicators
  • Help
    • Terminology Used in Structural Trading
    • Terminology Videos
    • FAQ
  • Structural Trading Educational Videos

Daily Archives: October 29, 2013

Does ES_F & 6J_F Correlate?

Gallery

Posted on October 29, 2013 by Kathy

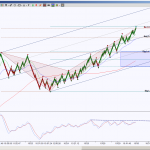
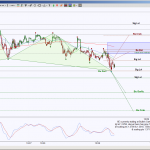
  Some traders like to watch correlation between ESZ13 (S&P Emini futures) and 6JZ13 (Japanese Yen futures).  So let’s take a look at both.  S&P continues to move to the upside with symmetrical pullbacks since the October 2012 bounce off … Continue reading →

Posted in Charts, Education, Patterns, Premium, Swing | Tagged 6J_F, Analysis, Charts, ES_F, patterns

Premarket and End of Day Harmonic Trading Charts 10/30/13

Gallery

Posted on October 29, 2013 by Kathy

This gallery contains 36 photos.

The end of day charts are the preliminary harmonic analysis for globex and following day’s premarket setups          

Posted in Charts, Education, Patterns, Premarket, Premium | Tagged 6E_F, Analysis, Charts, CL_F, DAX_F, ES_F, GC_F, NQ_F, patterns, premarket, SPY, TF_F, volume profile

Premarket and End of Day Harmonic Trading Charts 10/29/13

Gallery

Posted on October 29, 2013 by Kathy

This gallery contains 26 photos.

The end of day charts are the preliminary harmonic analysis for globex and following day’s premarket setups        

Posted in Charts, Education, Patterns, Premarket, Premium | Tagged 6E_F, Analysis, Charts, CL_F, DAX_F, ES_F, GC_F, NQ_F, patterns, premarket, SPY, volume profile

Premium Harmonic Trading Charts & Premarket Video for 10/30/2013

Gallery

Posted on October 29, 2013 by Kathy

Premium premarket video, click here.

Posted in Charts, Education, Patterns, Premarket, Premium | Tagged 6E_F, Analysis, Charts, CL_F, DAX_F, ES_F, GC_F, NQ_F, patterns, premarket, volume profile

RESOURCES


MotiveWave

Rancho Dinero's Acme Market Analytics suite is emerging as a leader in innovative market data visualization software for independent traders, market educators and limited partnerships worldwide. Rancho Dinero’s mission is simple – provide unexpectedly fresh, exceptionally clear, top-quality technical analysis products and first-class support at an unparalleled level of value.

Tags

  • 6B_F
  • 6E_F
  • 6J_F
  • AAPL
  • AMZN
  • Analysis
  • AUD/USD
  • BIDU
  • Charts
  • CL_F
  • DAX_F
  • DX_F
  • ES_F
  • EURUSD
  • FB
  • GBPUSD
  • GC_F
  • GLD
  • GOOG
  • IBB
  • IWM
  • Jerry
  • NFLX
  • NG_F
  • NQ_F
  • OptionDawg
  • Options
  • patterns
  • premarket
  • QQQ
  • RTY_F
  • SI_F
  • SPX
  • SPY
  • STBars
  • Swing
  • TF_F
  • TLT
  • Trigger
  • USDJPY
  • videos
  • volume profile
  • VP
  • ZB_F
  • Zones

Meta

  • Register
  • Log in
October 2013
M T W T F S S
 123456
78910111213
14151617181920
21222324252627
28293031  
« Sep   Nov »
Proudly powered by WordPress
Content Protected Using Blog Protector By: PcDrome.