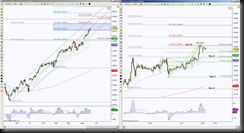
Mini Dow Futures’ longer term perspective (day chart) shows price stalled just below the GRZ (Golden Ratio Zone), creating tweezer tops until Friday (May 17, 2013) when price clearly closed above the 15251 level to tag the pitchfork midline as resistance. When price breaks through a level that was holding, it’s not uncommon for price to pullback to test it from the other direction.
The intraday chart (39 min) shows price completed a Bearish Crab and an AB=CD at 15325 & after stalling is attempting to retrace these patterns.
- The small Bearish Crab and ABCD has an ideal minimum retracement target at significant level 15274 region, a healthy retracement will help price pullback to test the GRZ as support
- A 61.8% retracement of the Crab correlates with the Day GRZ support
- A 40% retracement of the ABCD correlates with the Day GRZ support
- So the GRZ target of 15251 has confluence and becomes an important support test, a hold there implies an attempt to test the top of the GRZ which has two other rotational confluence correlation, an AB=CD and a 127.2 extension fib
- The intraday chart offers scaling points in route to the top of the GRZ 15516, the scaling points are 15361 and 15412 which both have correlation
- A hold below 15251 has the bottom of the pitchfork as support and 14823, which was a previous high that now becomes key support
- On an intraday perspective, there is correlation at the 15192 region, it’s a 100% of the Crab & approximately 78.6% retracement of the ABCD
- In a nutshell 15251 is the current line in the sand and targets regardless of which direction price goes
- Do not get married to a direction, a pattern or a bias, be liquid … after all, the market is liquid!

