Structural Trading

Building Trading Analysis Through Structure

Main menu

Skip to primary content
Skip to secondary content
  • Home
  • Login
  • Membership
  • Videos
    • Structural Trading Educational Videos
  • About
    • A Path To Trading
    • Vision Statement
    • Disclaimer
  • Resources
    • NinjaTrader & Kinetick
  • Help
    • Terminology Used in Structural Trading
    • FAQ

Tag Archives: ZN_F

Premarket and End of Day Harmonic Trading Charts 9/5/13

Gallery

Posted on September 5, 2013 by Kathy

This gallery contains 30 photos.

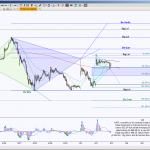
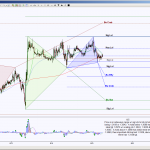
The end of day charts are the preliminary harmonic analysis for globex and tomorrow’s premarket        

Posted in Charts, Education, Patterns, Premarket, Premium | Tagged 6E_F, Analysis, Charts, CL_F, DAX_F, ES_F, NQ_F, patterns, premarket, TF_F, volume profile, ZN_F

Premarket and End of Day 6/5/13

Gallery

Posted on June 5, 2013 by Kathy

This gallery contains 28 photos.

The EOD charts show levels used for globex sessions and preliminary premarket Premarket / EOD    

Posted in Charts, Education, Patterns, Premium | Tagged 6E_F, Analysis, Charts, CL_F, DAX_F, ES_F, NQ_F, patterns, ZN_F

Premarket and End of Day 6/4/13

Posted on June 4, 2013 by Kathy


The EOD charts show levels used for globex sessions and preliminary premarket

Premarket / EOD

6-4-2013 6E 15m 6-4-2013 6E EOD

6-4-2013 CL 15m 6-4-2013 CL EOD

6-4-2013 DAX 15m 6-4-2013 DAX EOD

6-4-2013 ES 15m 6-4-2013 ES EOD

6-4-2013 NQ 15m 6-4-2013 NQ EOD

6-4-2013 ZN 15m 6-4-2013 ZN EOD

Posted in Charts, Education, Patterns, Premium | Tagged 6E_F, Analysis, Charts, CL_F, DAX_F, ES_F, NQ_F, patterns, ZN_F

All Access Charts for 6/4/2013

Gallery

Posted on June 2, 2013 by Kathy
Posted in Charts, Education, Patterns | Tagged Analysis, Charts, patterns, SPY, volume profile, ZN_F

Premium Charts and Premarket Video for 3/22/2013

Gallery

Posted on March 22, 2013 by Kathy

Premium premarket video, click here.

Posted in Education, Patterns, Premarket, Premium, Videos | Tagged 6E_F, AAPL, Analysis, Charts, CL_F, ES_F, GS, NQ_F, patterns, premarket, videos, volume profile, ZN_F

Premium Charts and Premarket Video for 3/13/2013

Gallery

Posted on March 13, 2013 by Kathy

Premium premarket video, click here.

Posted in Charts, Education, Patterns, Premarket, Premium, Videos | Tagged 6E_F, AAPL, Analysis, Charts, CL_F, ES_F, NQ_F, patterns, premarket, SPY, TF_F, videos, volume profile, ZN_F

RESOURCES

UPD

HTTA

Rancho Dinero's Acme Market Analytics suite is emerging as a leader in innovative market data visualization software for independent traders, market educators and limited partnerships worldwide. Rancho Dinero’s mission is simple – provide unexpectedly fresh, exceptionally clear, top-quality technical analysis products and first-class support at an unparalleled level of value.


MotiveWave

Structural Trading Tweets

  • $ES_F, $NQ_F, $CL_F, $GC_F, $ZB_F harmonic scenarios $$ https://t.co/gFWinO4Mhd 12:27:46 PM March 07, 2021 from Twitter Web App
  • RT @KayeEllen17: Please. Please. Please. Everyone PRAY for my daughter Molly. She has been in an accident and suffered a brain trauma. She’… 05:49:05 AM February 01, 2021 from Twitter for Android
  • $ES_F, $NQ_F, $CL_F, $GC_F, $ZB_F harmonic scenarios $$ https://t.co/MCp1YTrYla 01:40:55 PM January 31, 2021 from Twitter Web App
@tbg4321

Tags

  • 6B_F
  • 6E_F
  • 6J_F
  • AAPL
  • AMZN
  • Analysis
  • AUD/USD
  • BIDU
  • Charts
  • CL_F
  • DAX_F
  • DX_F
  • ES_F
  • EURUSD
  • FAS
  • FB
  • GBPUSD
  • GC_F
  • GLD
  • GOOG
  • GOOGL
  • IBB
  • IWM
  • Jerry
  • NFLX
  • NG_F
  • NQ_F
  • OptionDawg
  • Options
  • patterns
  • premarket
  • QQQ
  • RTY_F
  • SI_F
  • SPX
  • SPY
  • STBars
  • Swing
  • TF_F
  • TLT
  • Trigger
  • USDJPY
  • videos
  • volume profile
  • ZB_F

Meta

  • Register
  • Log in
March 2021
M T W T F S S
1234567
891011121314
15161718192021
22232425262728
293031  
« Feb    

Disclaimer

Structural Trading is not an investment adviser, nor a securities broker. Information shared here is intended for educational purposes only. All methods, techniques, indicators and setups shared by Structural Trading are not a guarantee of success or profit. Futures and Forex trading contains substantial risk and is not for every investor. An investor could potentially lose all or more than the initial investment. Risk capital is money that can be lost without jeopardizing ones’ financial security or life style. Only risk capital should be used for trading and only those with sufficient risk capital should consider trading. Past performance is not necessarily indicative of future results. Hypothetical performance results have many inherent limitations, some of which are described below. No representation is being made that any account will or is likely to achieve profits or losses similar to those shown; in fact, there are frequently sharp differences between hypothetical performance results and the actual results subsequently achieved by any particular trading program. One of the limitations of hypothetical performance results is that they are generally prepared with the benefit of hindsight. In addition, hypothetical trading does not involve financial risk, and no hypothetical trading record can completely account for the impact of financial risk of actual trading. for example, the ability to withstand losses or to adhere to a particular trading program in spite of trading losses are material points which can also adversely affect actual trading results. There are numerous other factors related to the markets in general or to the implementation of any specific trading program which cannot be fully accounted for in the preparation of hypothetical performance results and all which can adversely affect trading results. It is advised to NEVER follow a trade setup blindly, but rather always understand why a trade is entered and have risk management defined before entering a trade. Structural Trading will never share or sell personal information of members.
Proudly powered by WordPress
Content Protected Using Blog Protector By: PcDrome.
s2Member®