Structural Trading

Building Trading Analysis Through Structure

Main menu

Skip to primary content
Skip to secondary content
  • Home
  • Login
  • Membership
  • About
    • A Path To Trading
    • Vision Statement
    • Disclaimer
  • Resources
    • NinjaTrader & Kinetick
  • Help
    • Terminology Used in Structural Trading
    • Terminology Videos
    • FAQ
  • Structural Trading Educational Videos

Tag Archives: 6B_F

Post navigation

← Older posts

Intraday Harmonics for 6A, 6B, 6C and 6J

Gallery

Posted on June 6, 2014 by Kathy

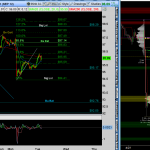
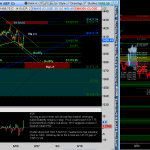
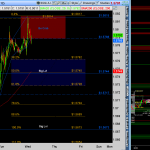
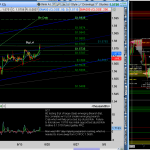
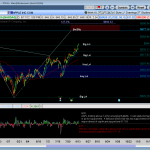
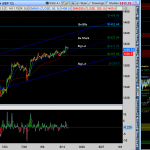
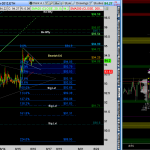
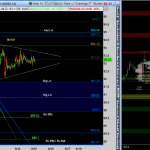
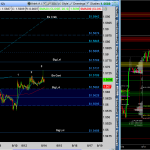
Harmonic Pattern Scenario comments on the charts

Posted in Charts, Education, Patterns, Premium, Swing | Tagged 6A_F, 6B_F, 6C_F, 6J_F, Analysis, Charts, patterns

Premarket Video for 8/28/2012 & Premium Member Charts

Gallery

Posted on August 28, 2012 by Kathy

This gallery contains 5 photos.

Premium members’ premarket video for $ES_F, $TF_F, $CL_F, $6E_F & $SI_F click here.        

Posted in Premium | Tagged 6B_F, 6E_F, Analysis, Charts, CL_F, ES_F, patterns, premarket, TF_F, videos, volume profile

Charts for 8/27/12 for Premium Members

Gallery

Posted on August 25, 2012 by Kathy

This gallery contains 12 photos.

**Note **  Use these longer timeframe charts throughout the week, intraday charts will be posted daily.  These will be formations occurring within the larger formations.                     

Posted in Charts, Education, Patterns, Premarket, Premium | Tagged 6B_F, 6E_F, AAPL, AMZN, Analysis, Charts, CL_F, ES_F, FAS, IWM, patterns, SI_F, SPY, TF_F, volume profile

Premarket Video for 8/22/2012 & Premium Member Charts

Gallery

Posted on August 22, 2012 by Kathy

This gallery contains 5 photos.

Premium members’ premarket video for $ES_F, $TF_F, $CL_F, $6E_F & $DX_F click here.      

Posted in Charts, Education, Patterns, Premarket, Premium, Videos | Tagged 6B_F, 6E_F, Analysis, Charts, CL_F, ES_F, patterns, premarket, SI_F, TF_F, videos, volume profile

Premarket Video for 8/21/2012 & Premium Member Charts

Gallery

Posted on August 21, 2012 by Kathy

This gallery contains 11 photos.

Premium members’ premarket video for $ES_F, $TF_F, $CL_F, $6E_F & $DX_F click here.                    

Posted in Charts, Education, Patterns, Premarket, Premium, Videos | Tagged 6B_F, 6E_F, AAPL, Analysis, Charts, CL_F, ES_F, IWM, patterns, premarket, SI_F, SPY, TF_F, videos, volume profile

Charts for 8/20/12 for Premium Members

Gallery

Posted on August 19, 2012 by Kathy

This gallery contains 9 photos.


Posted in Charts, Education, Patterns, Premium | Tagged 6B_F, 6E_F, AAPL, Analysis, Charts, CL_F, ES_F, IWM, patterns, SI_F, SPY, TF_F, volume profile

Premarket Video for 8/17/2012 & Premium Member Charts

Gallery

Posted on August 17, 2012 by Kathy

This gallery contains 10 photos.

Premium members’ premarket video for $ES_F, $TF_F, $CL_F, $6E_F & $DX_F click here.              

Posted in Charts, Education, Patterns, Premarket, Premium, Videos | Tagged 6B_F, 6E_F, Analysis, Charts, CL_F, DX_F, ES_F, patterns, premarket, SI_F, TF_F, videos, volume profile

Premarket Video for 8/16/2012 & Premium Member Charts

Gallery

Posted on August 16, 2012 by Kathy

This gallery contains 9 photos.

Premium members’ premarket video for $ES_F, $TF_F, $CL_F, $6E_F & $DX_F click here.              

Posted in Charts, Education, Patterns, Premarket, Premium, Videos | Tagged 6B_F, 6E_F, Analysis, Charts, CL_F, DX_F, ES_F, patterns, premarket, SI_F, TF_F, videos, volume profile, ZB_F

Premarket Video for 8/15/2012 & Premium Member Charts

Gallery

Posted on August 15, 2012 by Kathy

This gallery contains 9 photos.

Premium members’ premarket video for $ES_F, $TF_F, $CL_F, $6E_F & $DX_F click here.          

Posted in Charts, Education, Patterns, Premarket, Premium, Videos | Tagged 6B_F, 6E_F, Analysis, Charts, CL_F, DX_F, ES_F, patterns, premarket, SI_F, TF_F, videos, volume profile

Premarket Video for 8/14/2012 & Premium Member Charts

Gallery

Posted on August 14, 2012 by Kathy

This gallery contains 6 photos.

Premium members’ premarket video for $ES_F, $TF_F, $CL_F, $6E_F & $DX_F click here.        

Posted in Charts, Education, Patterns, Premarket, Premium, Videos | Tagged 6B_F, 6E_F, Analysis, Charts, CL_F, DX_F, ES_F, patterns, premarket, SI_F, TF_F, videos, volume profile

Post navigation

← Older posts

RESOURCES

EdgeProX

HTTA

Rancho Dinero's Acme Market Analytics suite is emerging as a leader in innovative market data visualization software for independent traders, market educators and limited partnerships worldwide. Rancho Dinero’s mission is simple – provide unexpectedly fresh, exceptionally clear, top-quality technical analysis products and first-class support at an unparalleled level of value.


MotiveWave

Structural Trading Tweets

  • $ES_F, $NQ_F, $Vol Profile, $zones $$ https://t.co/BIFEFppb8S 06:31:56 PM March 26, 2023 from Twitter Web App
  • $ES_F, $NQ_F, $CL_F, $GC_F, $ZB_F, $VolumeProfile, $zones $$ https://t.co/aI81RB9VkS 04:58:28 PM March 19, 2023 from Twitter Web App
  • $ES_F, $NQ_F, $CL_F, $GC_F, $ZB_F, $VolumeProfile, $zones $$ https://t.co/b6cVaAwFfC 03:08:56 PM March 12, 2023 from Twitter Web App
@tbg4321

Tags

  • 6B_F
  • 6E_F
  • 6J_F
  • AAPL
  • AMZN
  • Analysis
  • AUD/USD
  • BIDU
  • Charts
  • CL_F
  • DAX_F
  • DX_F
  • ES_F
  • EURUSD
  • FB
  • GBPUSD
  • GC_F
  • GLD
  • GOOG
  • IBB
  • IWM
  • Jerry
  • NFLX
  • NG_F
  • NQ_F
  • OptionDawg
  • Options
  • patterns
  • premarket
  • QQQ
  • RTY_F
  • SI_F
  • SPX
  • SPY
  • STBars
  • Swing
  • TF_F
  • TLT
  • Trigger
  • USDJPY
  • videos
  • volume profile
  • VP
  • ZB_F
  • Zones

Meta

  • Register
  • Log in
April 2023
M T W T F S S
 12
3456789
10111213141516
17181920212223
24252627282930
« Mar    

Disclaimer

Structural Trading is not an investment adviser, nor a securities broker. Information shared here is intended for educational purposes only. All methods, techniques, indicators and setups shared by Structural Trading are not a guarantee of success or profit. Futures and Forex trading contains substantial risk and is not for every investor. An investor could potentially lose all or more than the initial investment. Risk capital is money that can be lost without jeopardizing ones’ financial security or life style. Only risk capital should be used for trading and only those with sufficient risk capital should consider trading. Past performance is not necessarily indicative of future results. Hypothetical performance results have many inherent limitations, some of which are described below. No representation is being made that any account will or is likely to achieve profits or losses similar to those shown; in fact, there are frequently sharp differences between hypothetical performance results and the actual results subsequently achieved by any particular trading program. One of the limitations of hypothetical performance results is that they are generally prepared with the benefit of hindsight. In addition, hypothetical trading does not involve financial risk, and no hypothetical trading record can completely account for the impact of financial risk of actual trading. for example, the ability to withstand losses or to adhere to a particular trading program in spite of trading losses are material points which can also adversely affect actual trading results. There are numerous other factors related to the markets in general or to the implementation of any specific trading program which cannot be fully accounted for in the preparation of hypothetical performance results and all which can adversely affect trading results. It is advised to NEVER follow a trade setup blindly, but rather always understand why a trade is entered and have risk management defined before entering a trade. Structural Trading will never share or sell personal information of members.
Proudly powered by WordPress
Content Protected Using Blog Protector By: PcDrome.
s2Member®