
TLT, the ETF for 20+ year Treasury Bonds, Day chart shows price is stalling at a double triangle point aka a Significant Level located at 133.03. There is a rollover effect, increasing in that scenario with price holding below 133.03 while momentum holds below its respective midpoint. If so, then there’s a double PRZ between 123.13 to 121.18 which is calling price towards it, PRZ is a Potential Reversal Zone representing the completion target of a harmonic pattern and double PRZ represents two different harmonic patterns merging into one zone for their pattern completion.
Another part of the puzzle is the brown colored pattern is in Retrace Mode, its dreamed of target is 114.88 and the green and blue patterns are trying to help that scenario play out. But again that 133.03 is the current obstacle because if price holds above there, the retracement is considered shallow and implies a bounce attempt to at least test the top of the blue GRZ at 138.71. GRZ is a Golden Ratio Zone aka the area between a 38.2% and 61.8% Fibonacci’s. Where price can break and hold beyond a GRZ or PRZ offers initial directional bias, and above 138.71 increases the probability of testing 144.92 or even the extended target of 153.1. But alas, note that currently price is below that blue GRZ and there’s a gallant effort to pull toward the lower levels. So let the 133.03 be the initial guide.
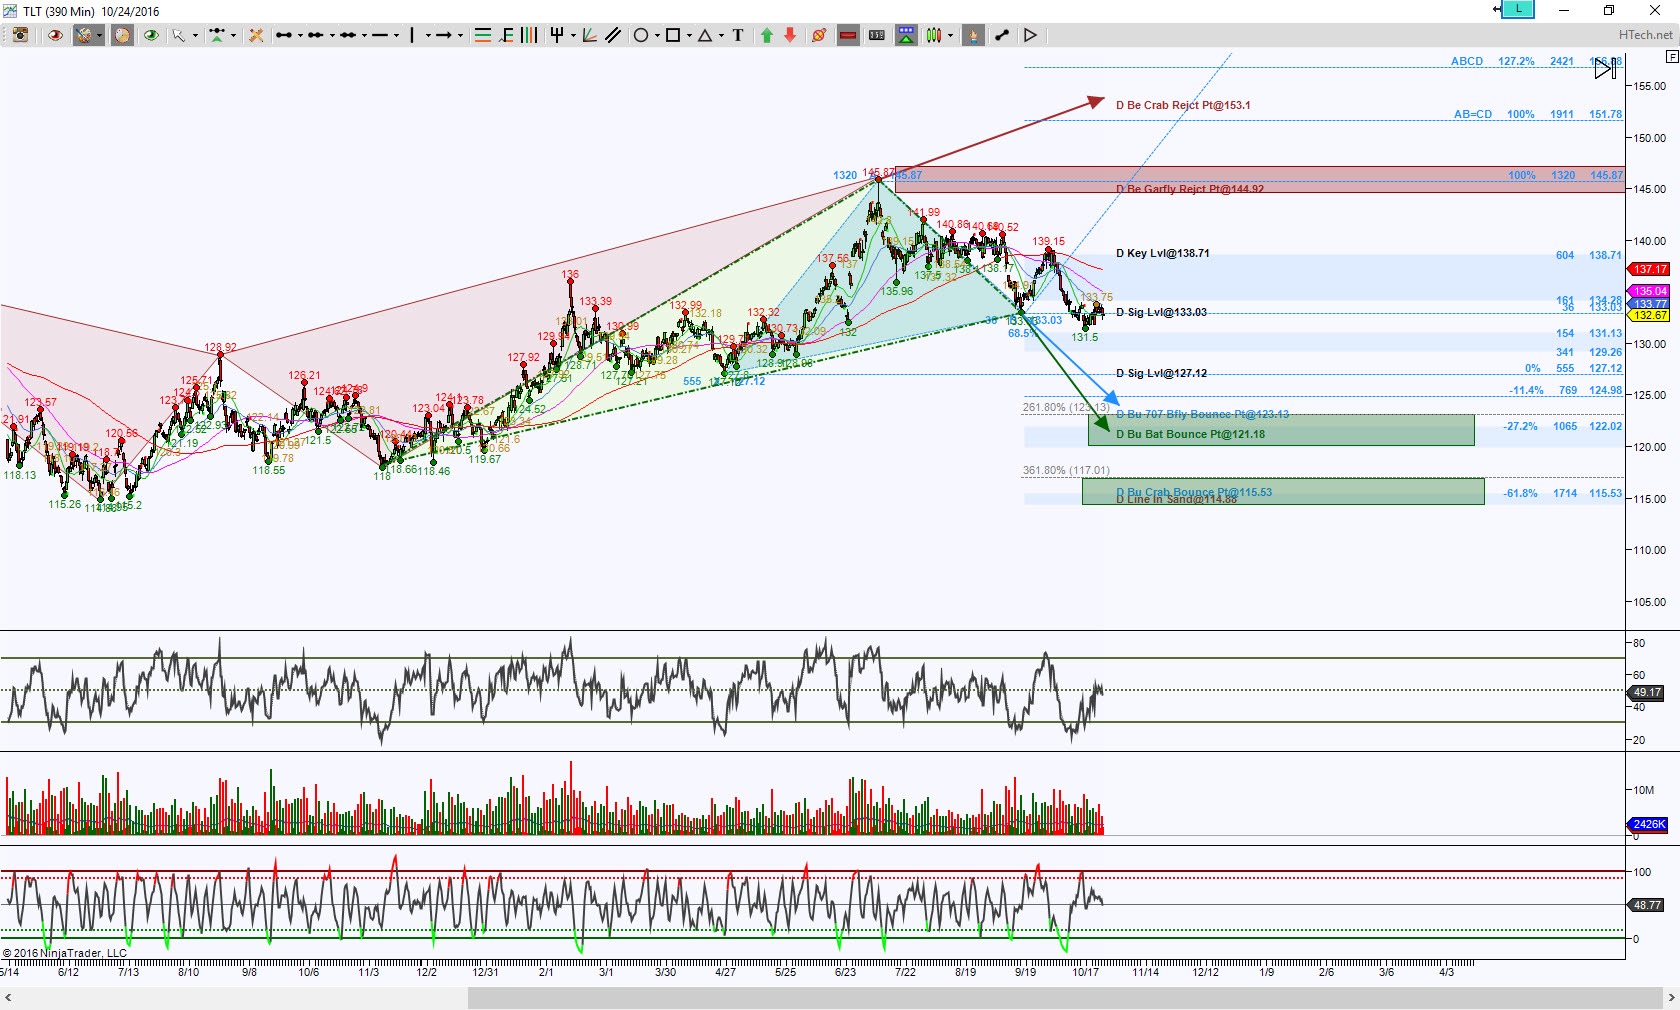
TLT Day Chart
Trading involves substantial risk and is not suitable for all investors. Past performance is not indicative of future results.