
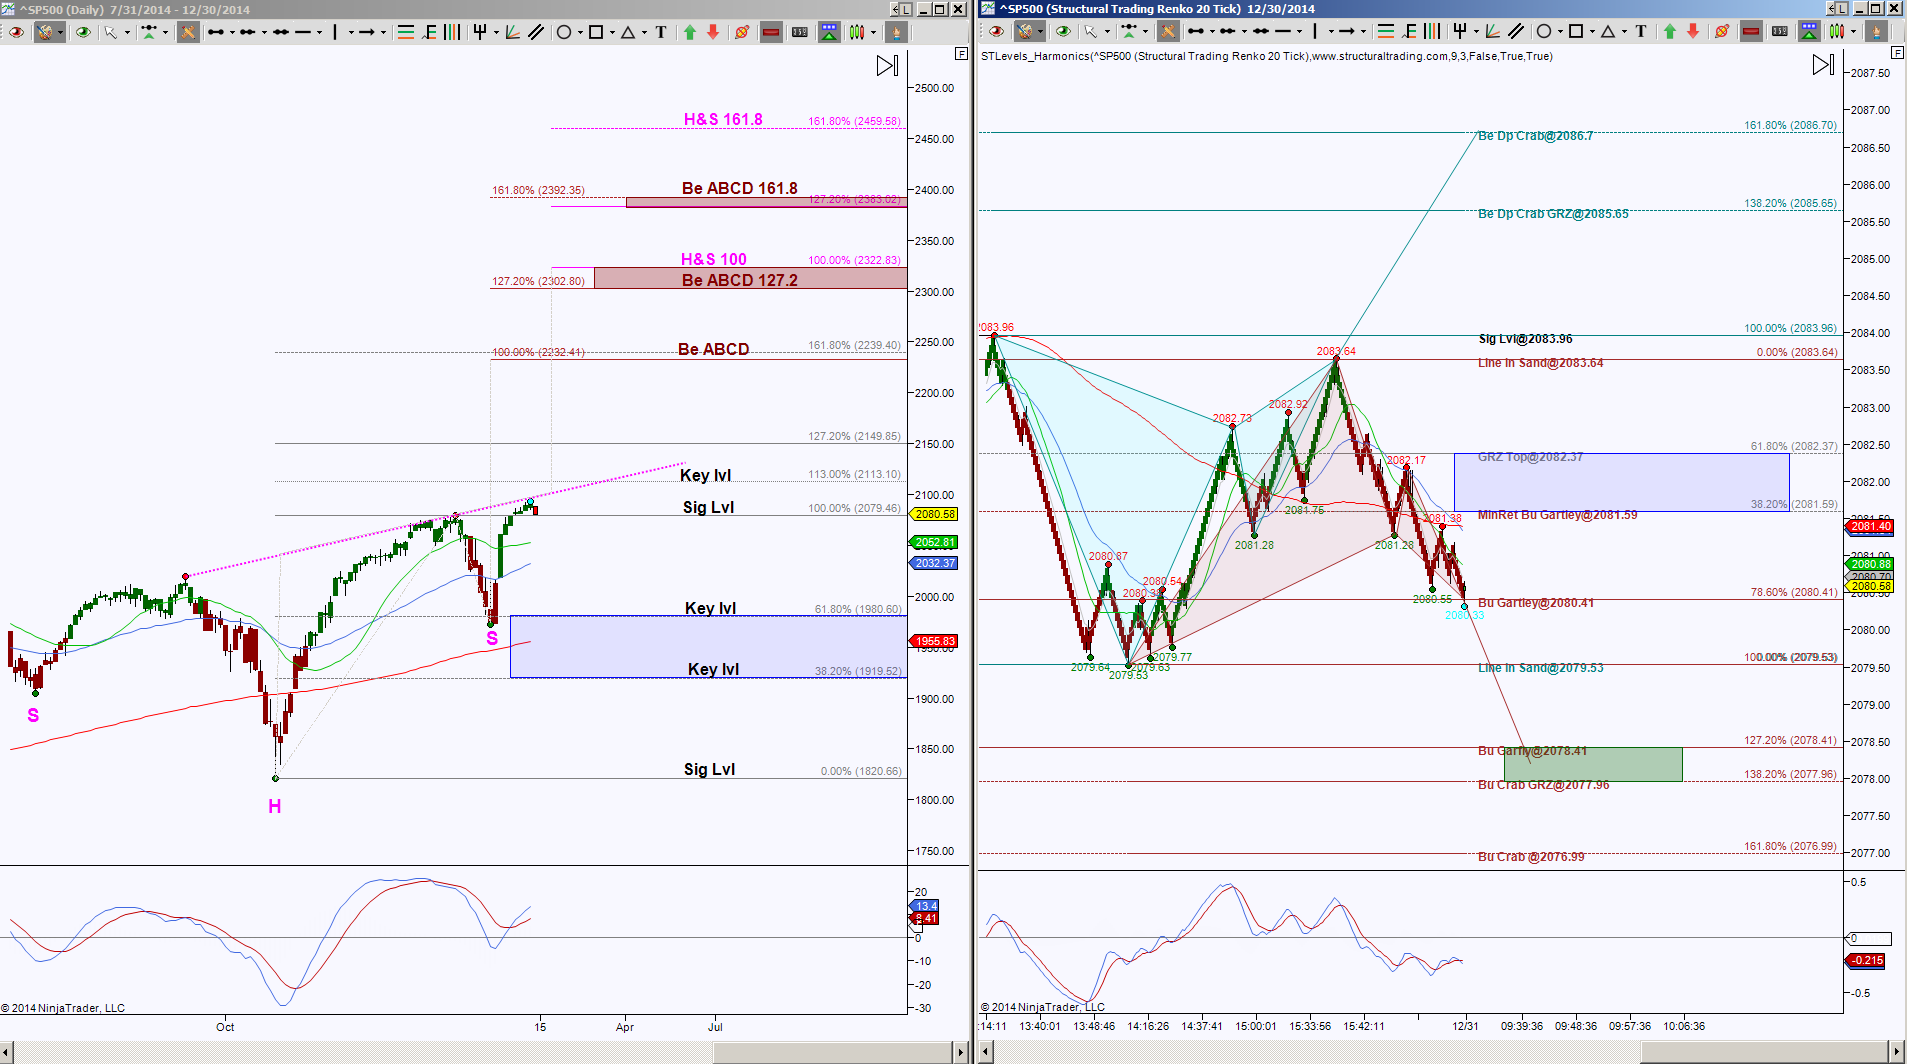
 The S&P 500 Day chart, on the left, shows price is in between an inverse Head & Shoulders neckline and a Significant Level at 2079.46. These being the initial levels to break and hold to increase the probability of testing the extended targets in either direction.
A push above the neckline as well as the 2113.10 Key Level has targets as noted with ABCD and H&S levels. There is confluence of a Golden Ratio extension and the initial ABCD target at 2232.41 area, then H&S / ABCD confluence at 2302.8 to 2322.83 and 2383.02 to 2392.35, which create zones that behave as upside targets, then scaling points or potential reversal points.
A hold below 2079.46 has the target of 1980.60 and scaling points along the way at 2052.81 and 2032.37. If price has downside continuation below 1980.60 then the inverse Head & Shoulders risks invalidation.
The intraday chart on the right has a zoomed in view of that “in between” area as mentioned for the Day chart. I’m using an STRenko 20 bar chart, and it shows that there have been two opposing patterns complete. This tells me a couple of things, one, that price is inside a range, that is always indicative of opposing emerging patterns, with the line in sand levels aka the region that can eliminate one of the patterns at 2083.64 and 2079.53. And two, it says that one pattern helped another retrace. That may not mean anything to someone who is not familiar with harmonic patterns but to me, I always find it fascinating that there’s so much interaction between patterns. I mean, think about it for a second, upon the completion of the cyan bearish pattern, called a Bat, this formed the first leg of the brown pattern, a Gartley. Then the completion of the Gartley helped that cyan Bat retrace 78.6%. Or, just call me a harmonic nerd.
So where price is now, intraday, tells me that there’s a probability of bouncing into 2081.4 to 2081.59. Keep in mind probabilities are not guarantees, but because this is a completion of a harmonic pattern at 2080.41, this offers a probability of at least an attempt to retrace, thus bounce. And I like to see if a harmonic pattern can retrace its ideal minimum of 38.2% or its dream target of 100%. Here’s the kicker, if price rejects or cannot even get to 2081.59, then the probability is downside continuation, with the ideal target for this chart at 2076.99 and scaling points at the brown fibs. This in turn helps the Day chart scenario of holding below the Significant level of 2079.46 to test those targets mentioned.
Bats and Gartleys have a duel purpose. They offer a potential rejection and/or reversal, or they are merely a means to an end. So this is a decision point for the intraday chart, was this 2080.41 a scaling point in route to lower completion targets? Or is this where price will retrace, or bounce in this instance, and push above an important resistance test of 2081.59? If the latter is the case, then that Gartley gets pretty excited about retracing 100%, and should price return to 2083.64, then that helps the Day chart price get closer to testing that neckline.
Detachment helps remove emotion in trading, having a plan helps one be prepared for any scenario, thus helps in being detached. Less emotion helps a trader make decisions on setups vs fear or wishful thinking.
2014 has come to a completion, may your next leg (2015) create harmonic expressions in all areas of your journey.
Trading Futures involves substantial risk & not suitable for all investors. Past performance not indicative of future results.