
Oil Futures Day chart is calling to start your engines to complete a harmonic pattern at 55.07 but the engines have stalled and if price holds below 48.22, there’s less probability unfolding to complete the pattern, in this case, called a Bat. So that 48.22 is the initial level to either hold above or below.
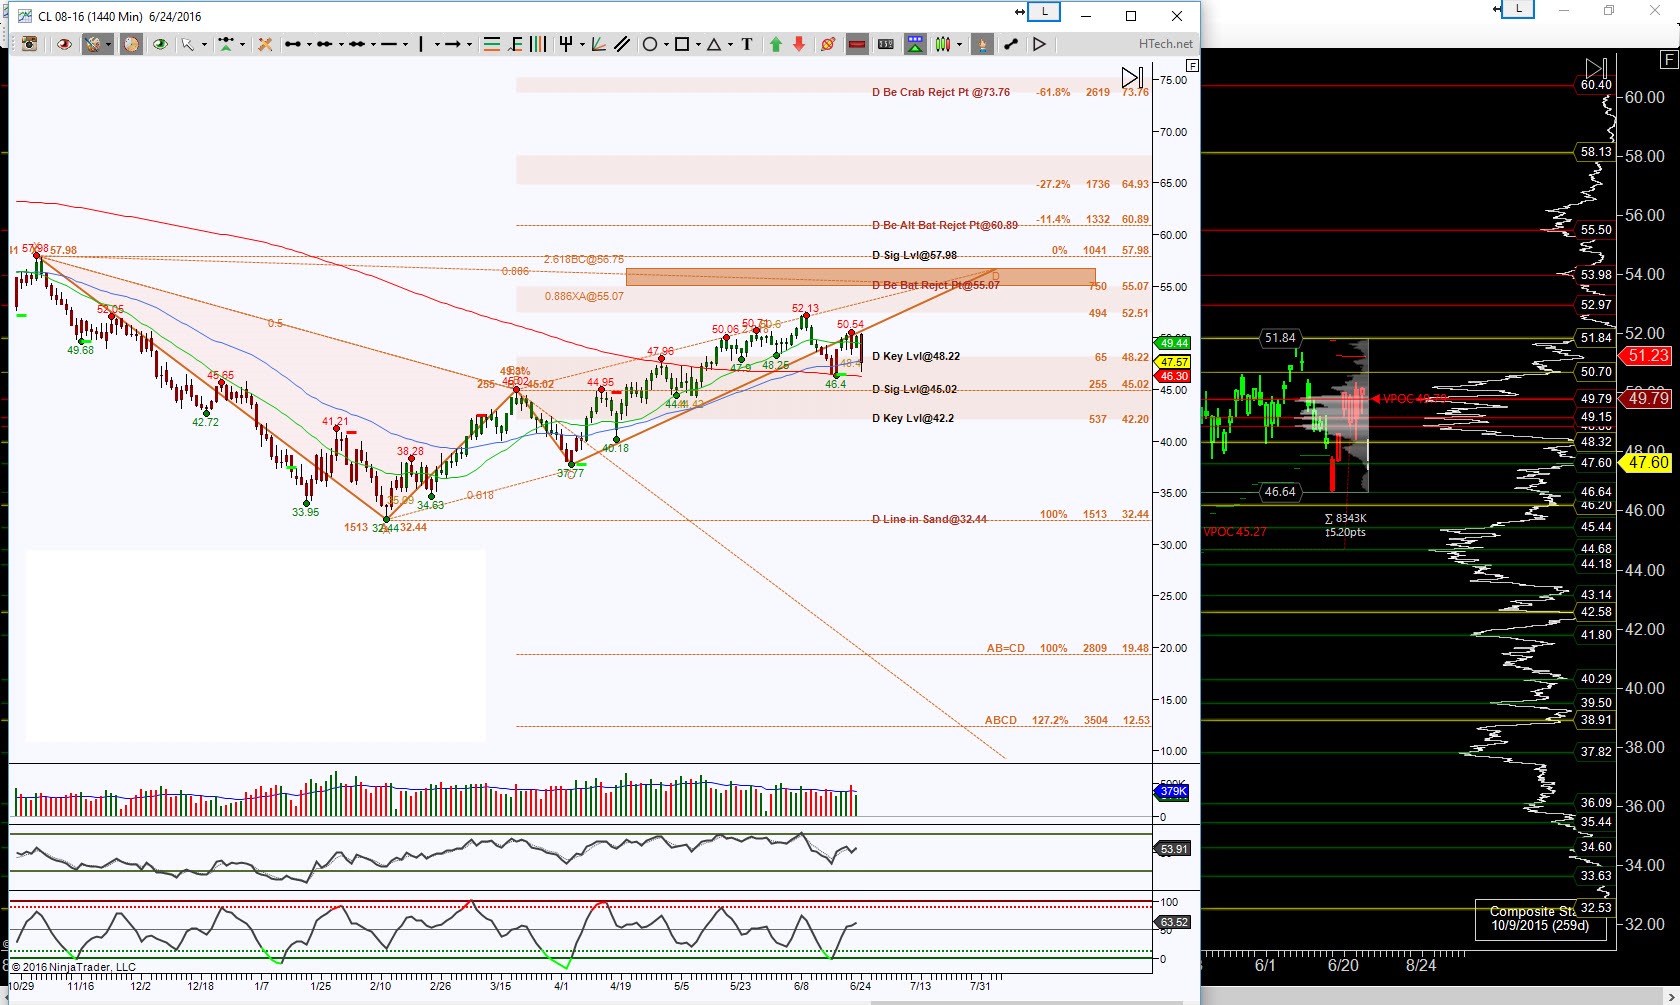
CL Day
A hold above 48.22, bulls want to gun it to get to the PRZ (Potential Reversal Zone aka a completion zone for a harmonic pattern). The PRZ entails the area between 55.07 to 56.75 and there is a potential breach to 57.98 or even 60.89, the point being, there are definite upside targets as noted on the chart, each one being a probable rejection point … note there is emphasis at “probable”, a trader needs to understand price action.
A hold below 48.22 has two primary initial pull back targets, 45.02 and 42.20, these are key support tests and as long as price can hold above these but most important above 48.22, the Bat stays in play. However below 42.20 increases the probability of a retest attempt of 32.44.
For an intraday perspective, I’m looking at an hour chart, yes this is still a large perspective for daytraders, but these are important levels to observe for intraday trading.
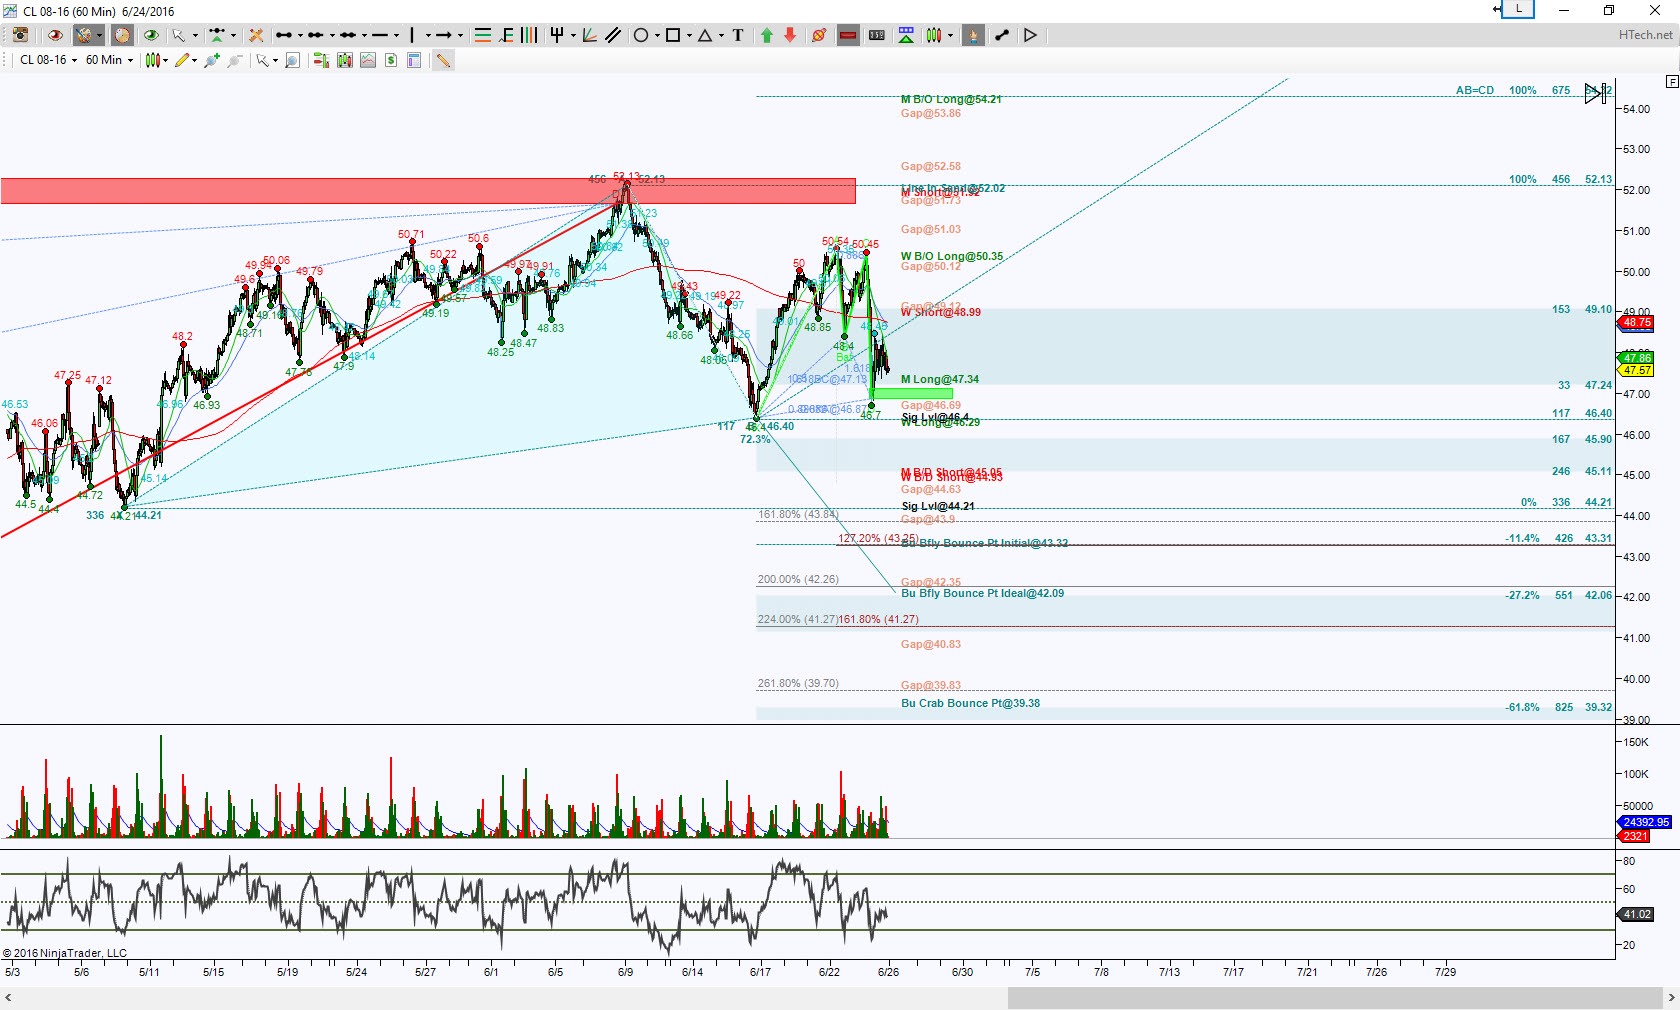
CL Hour
Notice the red zone on this hour chart? That represents a bearish pattern called a Butterfly’s PRZ and the rejection became a Retrace Mode attempt, so far the retracement is kind of embarrassing since the ideal minimum retracement target is 45.40.
A more zoomed in view shows price is inside a cyan colored GRZ (Golden Ratio Zone aka the area comprising of the 38.2% to 61.8% Fibonacci ratios), this is what I consider a decision region and once price can break and hold beyond this GRZ, there’s a clue of directional bias. So the top of the GRZ at 49.10 has heavy convergence meaning there needs some oomph to hold above there and if so, the probability increases to retest that red PRZ.
There is intraday downside bias as long as price holds below 49.10 then more important below 46.40 which is the initial support test target below the GRZ. Once price can hold below 46.40, the probability increases to test key levels which are also “probable” bounce points at 45.11, 43.31, 42.05 and 39.38.
Trading involves substantial risk and is not suitable for all investors. Past performance is not indicative of future results.