
Oil Futures Day chart shows that the pull has been to the upside, however due to expansion, the probability is a stall or pull back into support and there’s a key level at 37.68 meaning it’ll be important whether price holds above or below there.
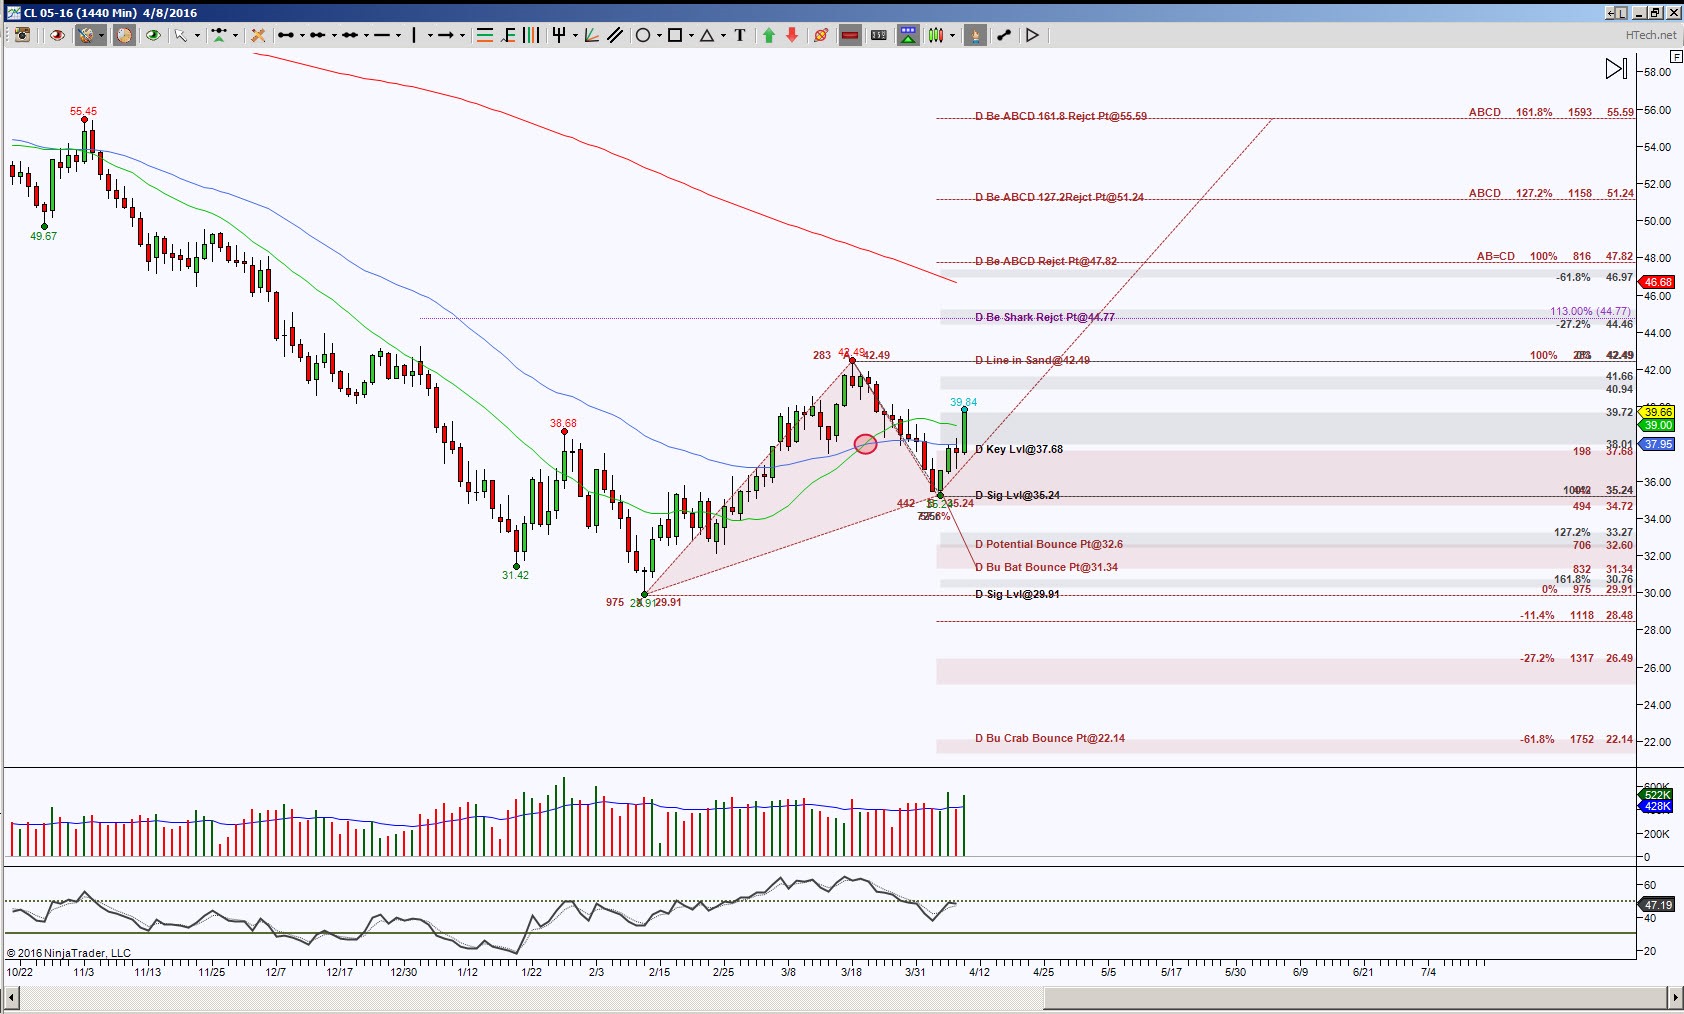
In the world of harmonics, there’s opposing emerging patterns and the Line In Sand, aka the do or die level for the Bat is 42.49. While 37.68 is the initial important support, the Significant resistance level is 42.49. If you’re a Daytrader, then these levels are quite a ways off, however, when price is at these levels, they’ll have importance whether they are support or resistance.
A hold above 42.49 has ideal targets at 44.77 and 47.82. Either one of these levels offer sellers an opportunity to step in but they are decisive points. So if sellers do step in then how much of a retracement of these harmonic patterns occurs will gauge the probability of whether higher or lower targets are hit. Should sellers fail to perform at these opportune levels, then it gives the buyers that much more oomph for higher targets.
Trading involves substantial risk and is not suitable for all investors. Past performance is not indicative of future results.