
The US Dollar Index, USDX in retracement mode of a bearish harmonic pattern called a Crab and clawing (stalling) at it’s ideal minimum retracement target.
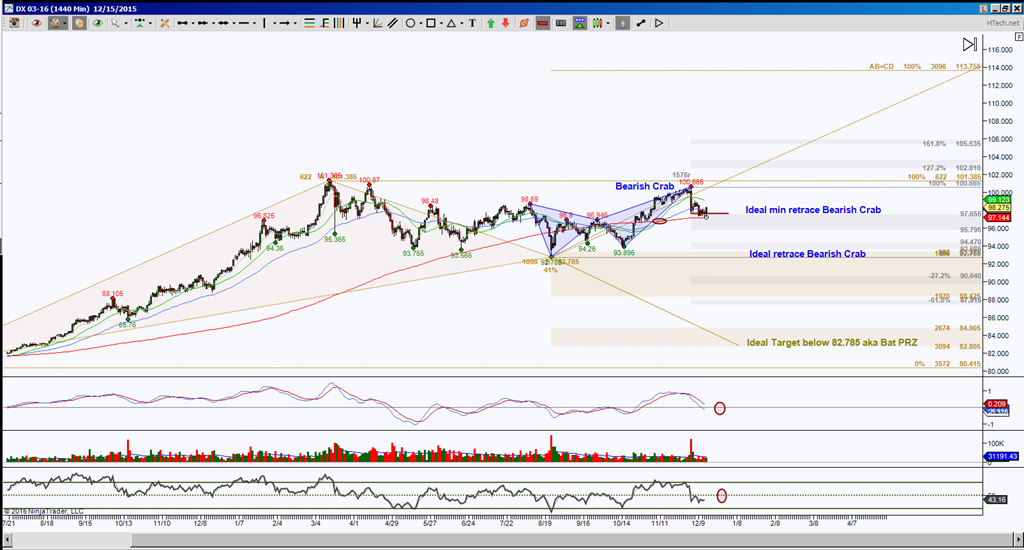
First of all, my 1440 minute chart shows there was a purpose for price to reach the 100.665 region, this was the completion target, aka PRZ (Potential Reversal Zone), of a Bearish Crab. The rejection of that area validated the pattern then began its attempt of a retracement mode for that harmonic pattern. The 97.655 level is the ideal minimum retrace target.
I’ve said it many times that it is my belief that every harmonic pattern dreams of retracing 100% or more. Yes, I personalize the patterns because they’re such an intricate part of my trading. And I always find it interesting how harmonic rotations and golden ratio zones make a statement on my charts. I’m referring to that large red bar that not only completed the pattern but rejected the PRZ in a swift move to exactly the GRZ (Golden Ratio Zone aka the area between the Fibonacci ratios of 38.2% to 61.8%) level of 97.655. I don’t know about you but that creates initial awe for me, then evolves into a confidence for a structured way of trading.
Back to the chart, this 97.655 region has convergence, meaning it’ll be a big deal for both scenarios of a hold above or below it. Although there is a downside pull as shown with momentum, this level is also a validation test of a bullish cross in the world of moving averages so this is definitely a decisive point, and personally I want to see conviction for either direction.
Because I like to be prepared for more than one scenario, I have targets regardless of which decision is made from this level. A hold above 97.655 and a momentum conviction implies a retest of 100.665 with a potential breach to the double top at 101.385. This is a line in the sand level for a much much larger harmonic pattern scenario, above it, again with conviction, has the ideal target at 113.755 with scaling points at 102.81 and 105.535.
A rejection or failure to test 101.385 or more importantly a hold below 97.655 continues with the retracement mode and the next ideal target is that dream come true level of 82.785 for a 100% retracement. Here again we have an important decision for that much larger pattern as shown in gold, a hold below there has the ideal target of 82.805 and scaling points at those fibs you see on the chart and I’d put some emphasis at the 88 area.
These are longer term targets, because this chart is equivalent to a Day chart timeframe.
Trading involves substantial risk and is not suitable for all investors. Past performance is not indicative of future results.