
I’m an avid espresso/coffee drinker, I actually did some Barista training from a coffee bean grower who used to be a nuclear physicist, needless to say, he was very methodical, analytical and focused on precision when it came to creating the “authentic” espresso. Here’s a tidbit most people aren’t aware of, there is more caffeine in brewed coffee than there is in espresso. I am as methodical, analytical and focused on precision when it comes to trading.
That being said, I’m looking initially at the coffee futures, KCH16, then GMCR and SBUX.
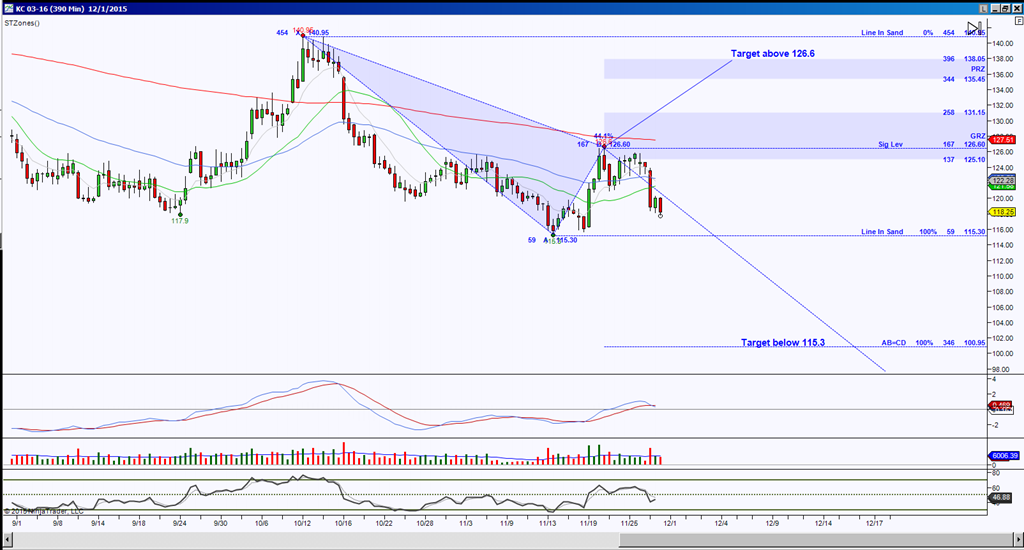
The Day chart for coffee futures March contract (KCH16) shows that price is in between opposing emerging harmonic patterns and the closest Line in Sand level is 115.30, so this will be an important support test, below it has 100.95 target. Since there is also an opposing pattern, be prepared for upside pull if price holds above 115.30, if so, the initial target of importance in resistance is 126.60, above there increases the probability of completing a harmonic pattern called a Bat at 138.05.
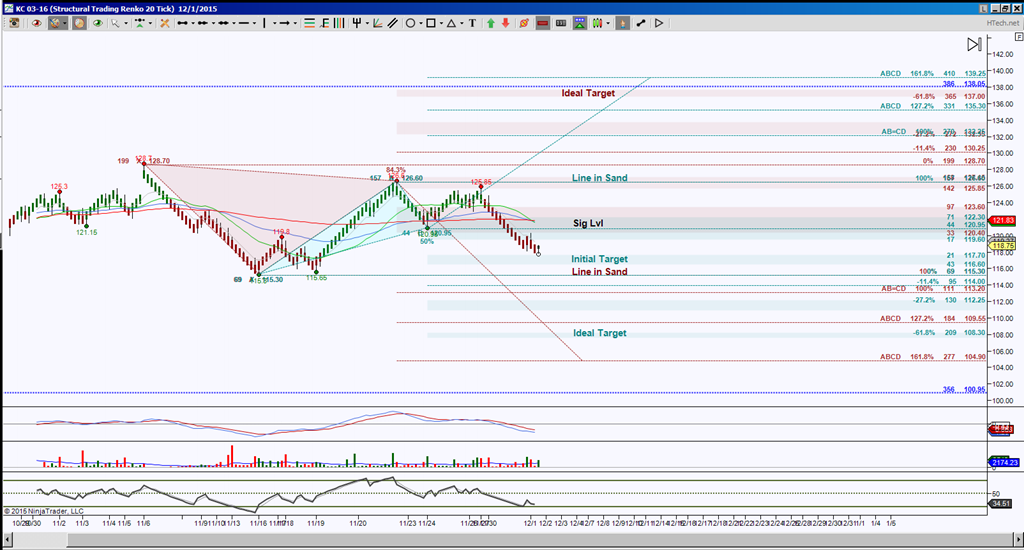
The intraday chart, in this case I’m using STRenko 20 bar chart also shows price in between opposing emerging patterns and same nearby Line in Sand level at 115.30. This offers a zoomed in view of what can play out to help the larger Day chart scenario. The initial levels to break and hold beyond is either above 120.95 for ideal target of 137 which correlates with the Day chart target of 138.05, or a hold below that 115.30 for 108.30 target which will take the price below the Line in Sand level and could help get to Day target of 100.95.
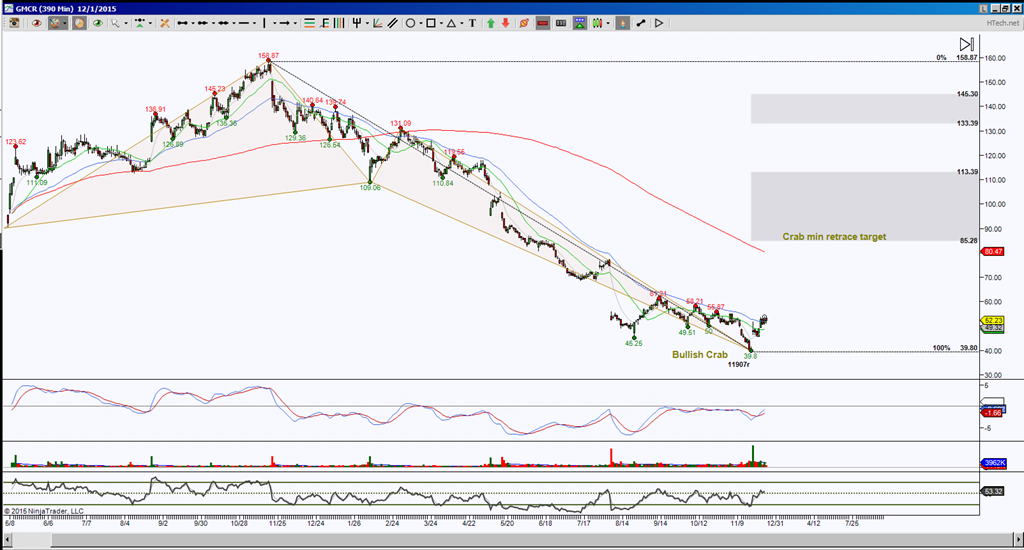
GMCR, Green Mountain Coffee Roasters, Day chart shows price has completed a bullish harmonic pattern, called a Crab and is currently attempting to go into retracement mode having an ideal minimum target of 85.28 and an ideal target of 158.87. First things first, right? Price needs to hold above 55.87 with conviction to increase the upside pull.
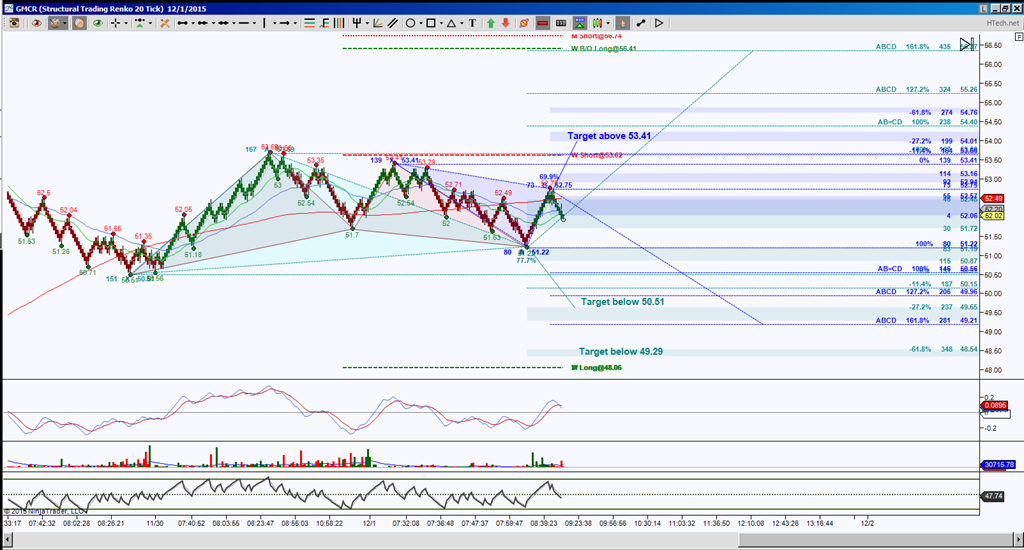
And the intraday perspective, in this case is an STRenko 20 bar chart, shows that the Day chart target is beyond intraday probable movements, but it does show that there’s indecision here, there’s opposing emerging patterns and the initial levels to break and hold are either above 52.75 for 54.01 target or below 51.22 for 49.65 target. There are extended targets showing, namely 56.41 to the upside and 48.54 to the downside, but first price needs to commit to breaking the 52.68 high or 50.56 low.
And finally, SBUX, Starbucks Day chart shows initial levels to break and hold beyond are either above 63.80 for 68.69 target or below 59.50 for 55.56 target. Until then price is just holding inside a sideways range.
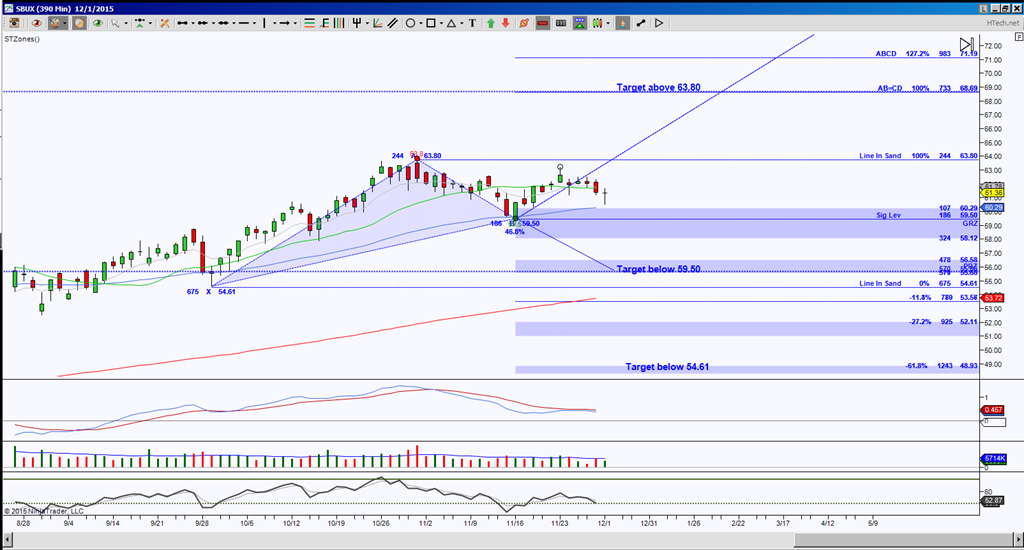
The SBUX intraday chart, STRenko 20 bar, shows that price is in retracement mode of a bullish ABCD harmonic pattern, it’s ideal minimum target is 61.54 and price is approaching it. This will be a key resistance test, if buyers can push it above there, the target is 62.4 region for another harmonic pattern, called a Shark, this acts like a rejection point and then will ideally like to see a pull back to around 60.52 for a potential bounce point. But that is thinking far ahead in the world of harmonics. First things first, let’s see if price can hold above 61.54. A rejection of 61.54 implies a retest attempt of the ABCD at 60.52, or possibly lower to the extended targets 59.98 and 59.30.
Trading involves substantial risk and is not suitable for all investors. Past performance is not indicative of future results.