
Nasdaq Futures has been floating inside harmonic patterns Crab and Shark PRZ (Potential Reversal Zone aka completion zone for harmonic pattern) since August. There have been multiple attempts to go into Retrace Mode for these patterns, which would be to the downside since these are both bearish patterns, but so far the Day chart shows embarrassing retracements and lack of conviction for that Retrace mode scenario.
The bottom of the double PRZ is 4813.50 and this is the initial level to hold or not. On one side of the ocean bed is all levels of the PRZ have not been tested, namely 4952.25, on the other, if price can hold below 4813.50 the probability is another attempt for Retrace Mode. The ideal minimum target is 4508 and ideal targets are 4381, 4240 and last but not least 3842.50. Yeah, that would be a huge drop should that target be met but keep in mind that each one of the noted targets are probable bounce points, offering an opportunity for buyers to step back in. I focus on this Retrace Mode scenario because there currently is a downside pull on the Day chart, increasing in that scenario below 4715.50.
The downside bias is at risk with a bounce off 4715.50 or more important a hold back inside the double PRZ, that would imply another attempt to test the top at 4952.25. Now if price is able to hold above there, then harmonically speaking, I’m looking for the 5255.50 next target.
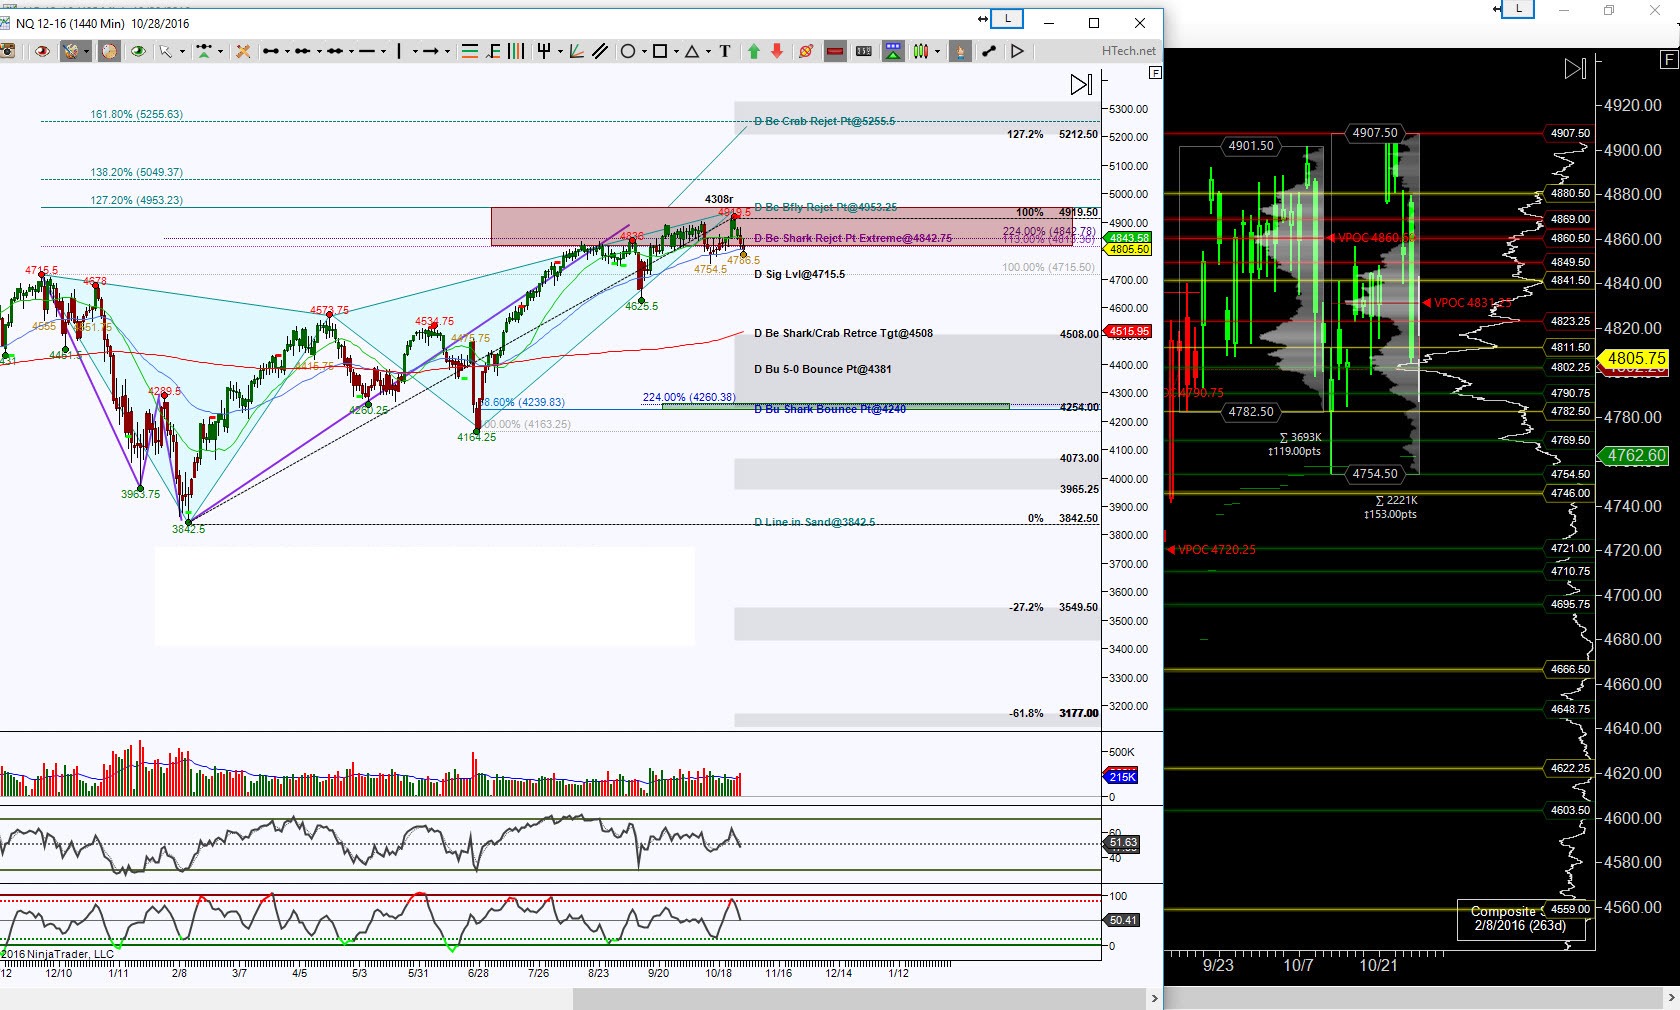
NQ_F Day Chart
For an intraday perspective, I’m looking at an STRange 20 bar chart, this is geared more for intraday traders but it also shows a zoomed in view of what’s happening at the bottom of that Day PRZ.
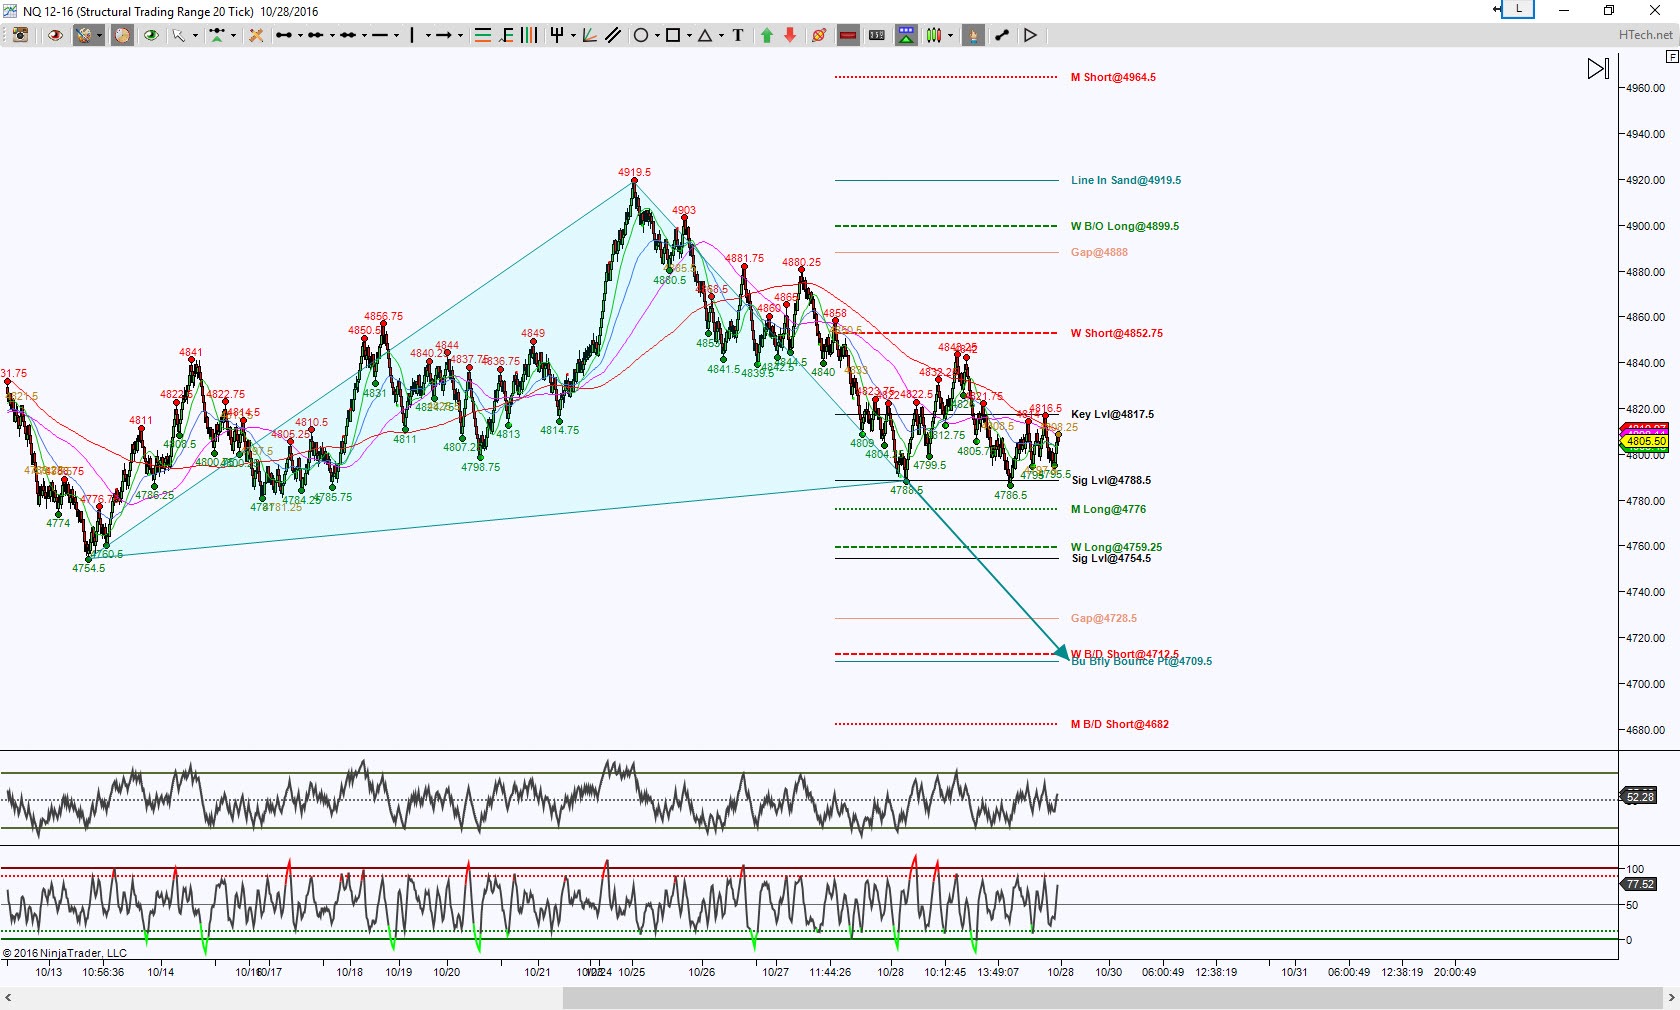
NQ_F STRange20
This cart shows a stall between what I consider a Key Level at 4817.50 and a Significant Level at 4788.50, these being the initial levels to break and hold for an immediate directional outlook. Above 4817.50 risks shifting the current downside bias to an upside pull and increases the probability of testing 4852.75 or higher noted targets, and the 4919.50 being a very important harmonic pattern resistance test because it is the do or die level for an emerging pattern as shown in cyan color. This scenario of upside break will help price return inside the Day chart’s double PRZ. There is an ever so slightly upside pull here but failure to hold above 4817.50 keeps price in the stall region.
Since there is no strong conviction yet for a break in either direction, be prepared for either scenario of a break. A downside break of 4788.50 does have an ideal target at 4709.50 to complete a Butterfly harmonic pattern with scaling points along the way at the noted levels and emphasis at 4754.50. Note this scenario will help price dip below its Significant Level 4715.50. Any time there is a completion of a harmonic pattern, it is a decisive region and understanding price action is a component of trading harmonic patterns successfully.
Trading involves substantial risk and is not suitable for all investors. Past performance is not indicative of future results.