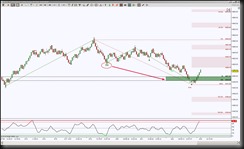
My intraday perspective chart is an STRange 50 bar, which shows that a Bullish Bat completed and is currently in a Retrace Mode attempt, it is flying toward the targets but can price get there before the sun dawns?
What’s different on my chart is that I didn’t draw the Bat, a new Harmonic Trader tool in Ninja Trader did, it labeled the X, A, B, C, D points, the pattern name and auto drew the PRZ. The HSI, another new Ninja Trader tool from Harmonic Trader, clearly shows positive divergence as price pushed back inside then above the PRZ, increasing the probability of going into Retrace Mode.
I did use my proprietary drawing tool, STZones, to display the retrace target zones, as colored in brown. The first zone is what I call the GRZ, Golden Ratio Zone which is the area between the 38.2% and 61.8% ratios.
So as long as price can hold above 4457.5, the probability of testing the GRZ is strong. What happens at the GRZ is another decisive point.
But if price holds back below the PRZ, with conviction, then I’ll be looking for lower prices, ideally around 4336.25.
Trading involves substantial risk and is not suitable for all investors. Past performance is not indicative of future results.

