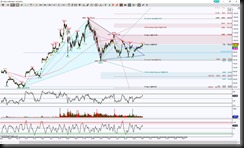
$NFLX Day chart shows there is a surge above a triangular formation, but meeting a Key Level referenced by a GRZ (Golden Ratio Zone aka the area of Fibs between 38.2% and 61.8% which happens to correlate with the 200 MA. This would suggest a stall or attempt to pullback to the triangle breakout point but overall, whenever price is inside a GRZ, where it can break beyond it with conviction offers initial directional bias.
So price is testing top of the GRZ, so far there’s not conviction to hold above it. There could just be a shallow pullback with the middle of the GRZ as a good gauge, a hold would imply an upside pull and ideally the target is 133.27 but a definite scaling point opportunity at 121.86.
Always be prepared for opposing scenario since we do not have the power to move the markets, we just have probabilities. Should price hold below 99.65 then more important below 89.27 the bottom of the GRZ is the do or die support test for the brown pattern. Below 79.95 has 64.09 target.
This chart has opposing emerging Gartley’s, this is one of those instances that both patterns could play out but the brown pattern would have to complete first at 121.86. I just find this interesting when two opposing patterns do both get to unfold.
Trading involves substantial risk and is not suitable for all investors. Past performance is not indicative of future results.

