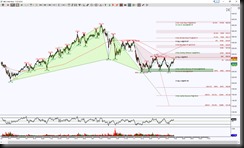
$IBB, the ETF for Nasdaq Biotechnology, has been bouncing like a ping pong between a Significant Level 289.5 and harmonic pattern PRZ (Potential Reversal Zone – aka the completion zone for a harmonic pattern) 240.03. So until price can break and hold beyond one of these levels the bias is neutral and the Range Trading Method remains in play (this is where you sell at the top of the range and buy at the bottom of the range). Of course this Range method works great until it breaks so risk is defined at the range extremes.
When price is in a range, it is logical that price can break either side so it’s best to be prepared for all scenarios when trading, this eliminates the “Uh Oh, What Do I Do Now” dilemma. So an upside break and hold above 289.50 has key targets, the first being 304.20, this is twofold in a resistance target, first is is the ideal minimum retrace target for the green colored Bullish Gartley harmonic pattern, second is the top of the brown GRZ (Golden Ratio Zone, the area between a 38.2% and 61.8% Fibonacci levels). So this first target is a recommended scaling point to either take some profit if you’re long or protect your position so that a winner stays a winner. The second target is 332.03, this is a PRZ for the brown colored harmonic pattern called a Bearish Bat, again a recommended scaling point. Of course there are higher ideal targets of 400.79 and 408.04 but first things first, right?
Since price is approaching top of the range, keep eye on that 289.5 level, a rejection keeps the Range Method in play with ideal initial target of 240.03 retest, but a break down there has an ideal target of 154.9 and scaling points at 207.48 and 185.66.
Trading involves substantial risk and is not suitable for all investors. Past performance is not indicative of future results.

